 by our College Data Analytics Team
Here is an overview of this program at SCU. You can study it at the Bachelor’s level. Its best result is a rank of #12 out of 63 schools (Bachelor’s level) by College Factual. Jump to any of the following sections:
College Factual rates SCU highly for biological & biomedical sciences, ranked #57 out of 1,342 schools nationally.
| Ranking | Rank |
|---|---|
| Best Biological & Biomedical Sciences Schools | 57 of 1,342 |
| Best Biological & Biomedical Sciences Schools in California | 13 of 143 |
Here is each degree level offered in biological & biomedical sciences at SCU, along with how many graduates complete each level annually.
| Degree Level | Annual Graduates |
|---|---|
| Bachelor’s | 87 |
This biological & biomedical sciences field at SCU covers the following majors. Choose a major for its full rankings, popularity, and outcomes:
| Major | Annual Graduates |
|---|---|
| Biology, General | 51 |
| Neurobiology and Neurosciences | 26 |
| Biochemistry, Biophysics and Molecular Biology | 10 |
For the most recent IPEDS reporting year, Santa Clara University conferred 87 bachelor’s degrees in biological & biomedical sciences.
SCU holds a strong position among schools offering biological & biomedical sciences at the bachelor’s level. Its best result was #12 out of 63 schools by College Factual.
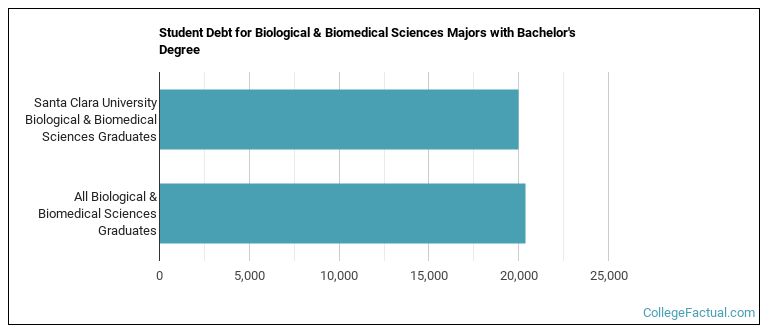
Earning a bachelor’s degree at SCU, biological & biomedical sciences students accumulate a median of $19,970 in student loans. This is lower than $20,351, the typical median for all majors at SCU.
Average full-time tuition and fees are listed in the table below.
| In State | Out of State | |
|---|---|---|
| Tuition | $55,224 | $60,639 |
| Fees | $654 | $654 |
Find out more about SCU tuition and fees.
For the most recent academic year available, 33% of biological & biomedical sciences bachelor’s degrees went to men and 67% went to women.
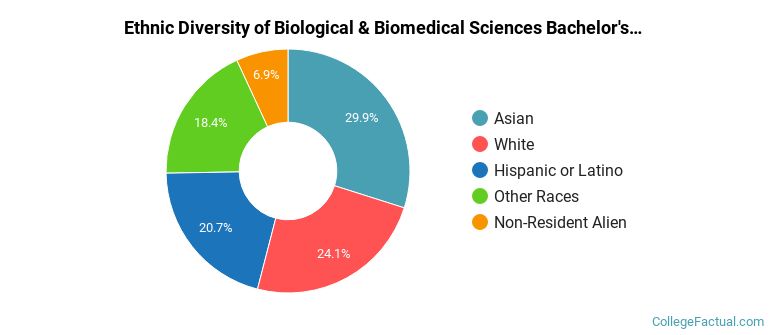
 The majority of biological & biomedical sciences bachelor’s degree graduates at SCU were Asian. Approximately 30% of graduates fell into this category.
The following table and chart show the ethnic background for students who recently graduated from Santa Clara University with a bachelor’s in biological & biomedical sciences.
| Ethnic Background | Number of Students |
|---|---|
| Asian | 26 |
| Black or African American | 0 |
| Hispanic or Latino | 18 |
| White | 21 |
| Non-Resident Aliens | 6 |
| Other Races | 16 |