SCU total enrollment is approximately 8,616 students. 5,478 are undergraduates and 1,953 are graduate students.
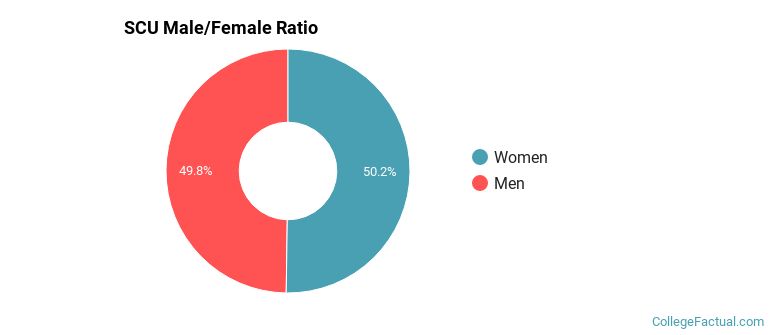
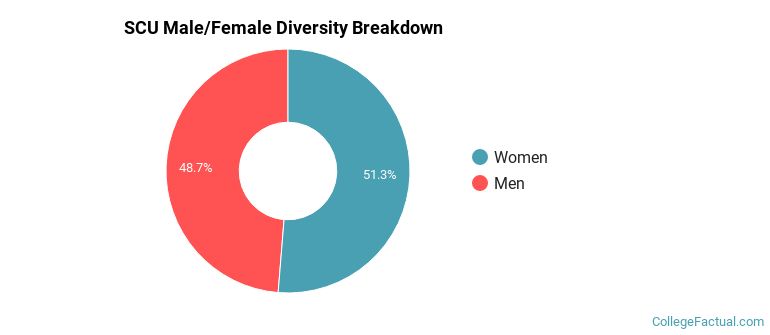
Male/Female Breakdown of Undergraduates
The full-time SCU undergraduate population is made up of 48% women, and 52% men.
For the gender breakdown for all students, go here.
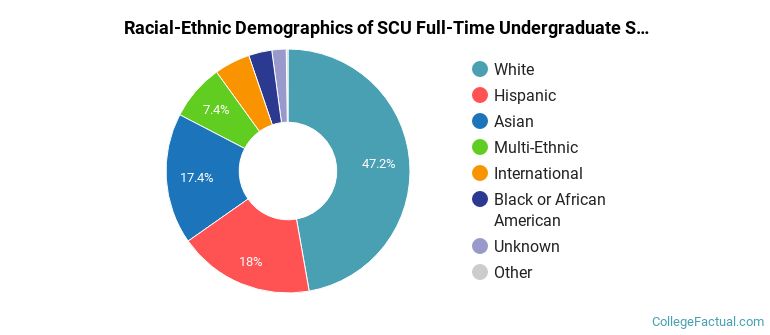
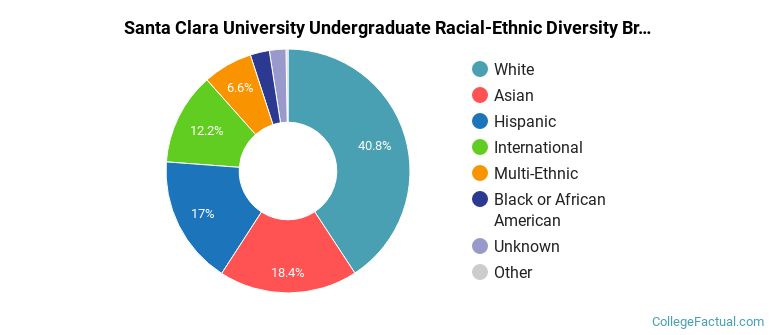
SCU Racial/Ethnic Breakdown of Undergraduates
| Race/Ethnicity | Number |
|---|---|
| White | 2,422 |
| Asian | 1,061 |
| Hispanic | 977 |
| Multi-Ethnic | 460 |
| International | 289 |
| Black or African American | 147 |
| Unknown | 107 |
| Native Hawaiian or Pacific Islander | 14 |
See racial/ethnic breakdown for all students.
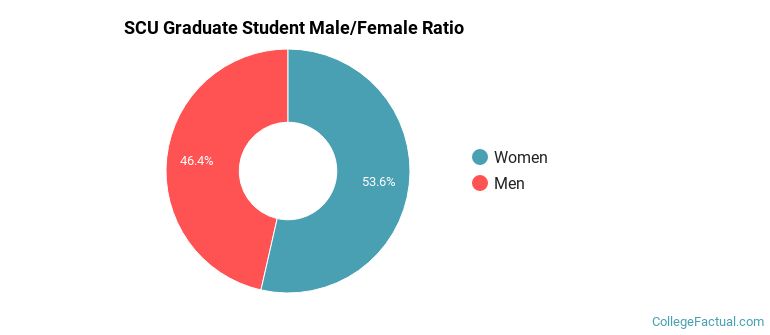
Male/Female Breakdown of Graduate Students
About 53% of full-time grad students are women, and 47% men.
For the gender breakdown for all students, go here.
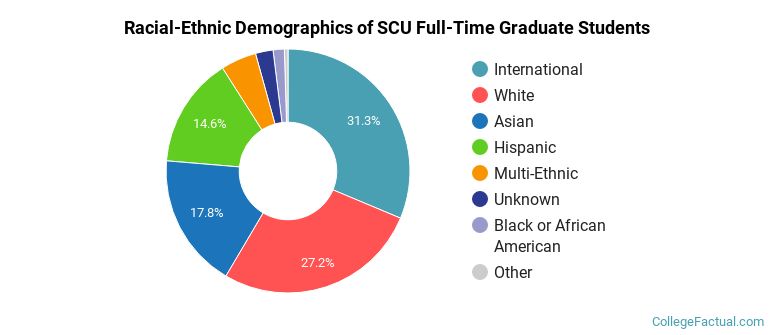
SCU Racial-Ethnic Breakdown of Graduate Students
| Race/Ethnicity | Number |
|---|---|
| White | 571 |
| International | 480 |
| Asian | 386 |
| Hispanic | 335 |
| Multi-Ethnic | 99 |
| Black or African American | 39 |
| Unknown | 36 |
| Native Hawaiian or Pacific Islander | 7 |
See racial/ethnic breakdown for all students.
| Race/Ethnicity | Number |
|---|---|
| White | 3,376 |
| Asian | 1,715 |
| Hispanic | 1,499 |
| International | 974 |
| Multi-Ethnic | 621 |
| Black or African American | 219 |
| Unknown | 187 |
| Native Hawaiian or Pacific Islander | 23 |
There are approximately 4,325 female students and 4,291 male students at SCU.
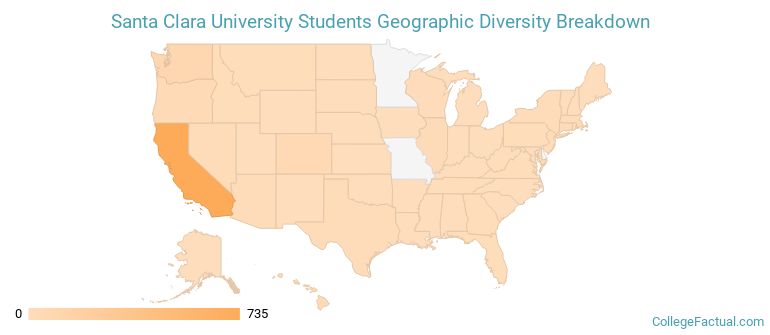
SCU ranks 264 out of 2,183 when it comes to geographic diversity.
40.68% of SCU students come from out of state, and 5.92% come from out of the country.
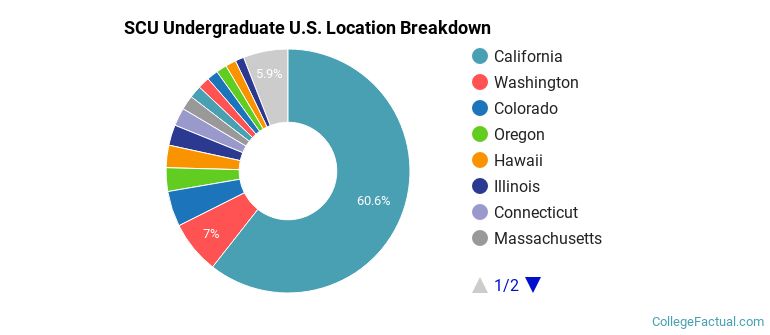
The undergraduate student body is split among 37 states (may include Washington D.C.). Click on the map for more detail.
| State | Amount |
|---|---|
| California | 735 |
| Washington | 85 |
| Colorado | 57 |
| Oregon | 38 |
| Hawaii | 36 |
Students from 81 countries are represented at this school, with the majority of the international students coming from India, China, and Taiwan.
Learn more about international students at SCU.
A traditional college student is defined as being between the ages of 18-21. At SCU, 56.67% of students fall into that category, compared to the national average of 60%.
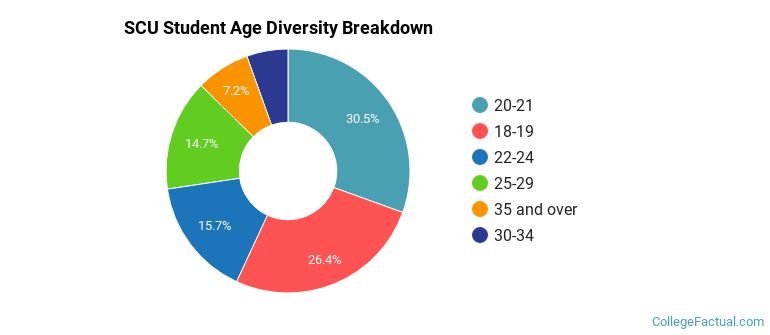
| Student Age Group | Amount |
|---|---|
| 20-21 | 2,622 |
| 18-19 | 2,268 |
| 22-24 | 1,350 |
| 25-29 | 1,266 |
| 35 and over | 615 |
| 30-34 | 471 |
| Under 18 | 0 |
Footnotes
*The racial-ethnic minorities count is calculated by taking the total number of students and subtracting white students, international students, and students whose race/ethnicity was unknown. This number is then divided by the total number of students at the school to obtain the racial-ethnic minorities percentage.
References
Department of Homeland Security Citizenship and Immigration Services
Read College Factual's Diversity Ranking Methodology.