Explore the best ranked schools for the programs you are most interested in.
Sarah Lawrence is ranked #458 out of 2,152 schools in the nation for overall quality on College Factual's 2025 Best Colleges list. This is an improvement over the previous year, when Sarah Lawrence held the #774 spot on the Best Overall Colleges list.
Out of the 136 colleges in New York, Sarah Lawrence is ranked at #45.
Sarah Lawrence College has an acceptance rate of 50%, which means the school is serious about who it admits. Take your time in putting together a strong application that highlights why you are a good fit for Sarah Lawrence.
About 15% of students accepted to Sarah Lawrence submitted their SAT scores. When looking at the 25th through the 75th percentile, SAT Evidence-Based Reading and Writing scores ranged between 660 and 740. Math scores were between 600 and 710.
The student to faculty ratio is often used to measure the number of teaching resources that a college or university offers its students. The national average for this metric is 15 to 1, but at Sarah Lawrence it is much better at 11 to 1. That's good news for students who want to interact more on a personal level with their teachers.
Another measure that is often used to estimate how much access students will have to their professors is how many faculty members are full-time. The idea here is that part-time faculty tend to spend less time on campus, so they may not be as available to students as full-timers.
The full-time faculty percentage at Sarah Lawrence College is 37%. This is lower than the national average of 47%.
The freshmen retention rate of 79% tells us that most first-year, full-time students like Sarah Lawrence College enough to come back for another year. This is a fair bit higher than the national average of 68%. That's certainly something to check off in the good column about the school.
Students are considered to have graduated on time if they finish their studies within four years. At Sarah Lawrence the on-time graduation rate of first-time, full-time students is 66%. That is great when compared to the national average of 33.3%
Find out more about the retention and graduation rates at Sarah Lawrence College.
During the 2017-2018 academic year, there were 1,292 undergraduates at Sarah Lawrence with 1,274 being full-time and 18 being part-time.
| $0-30 K | $30K-48K | $48-75 | $75-110K | $110K + |
|---|---|---|---|---|
| $19,228 | $21,837 | $24,314 | $25,876 | $40,777 |
The net price is calculated by adding tuition, room, board and other costs and subtracting financial aid.Note that the net price is typically less than the published for a school. For more information on the sticker price of Sarah Lawrence, see our tuition and fees and room and board pages.
It's not uncommon for college students to take out loans to pay for school. In fact, almost 66% of students nationwide depend at least partially on loans. At Sarah Lawrence, approximately 45% of students took out student loans averaging $9,120 a year. That adds up to $36,480 over four years for those students.
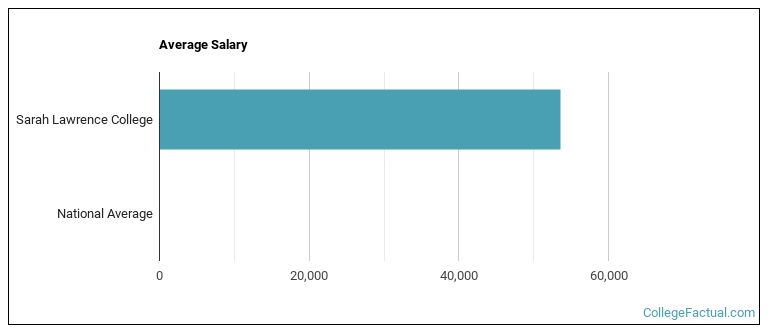
See which majors at Sarah Lawrence College make the most money.
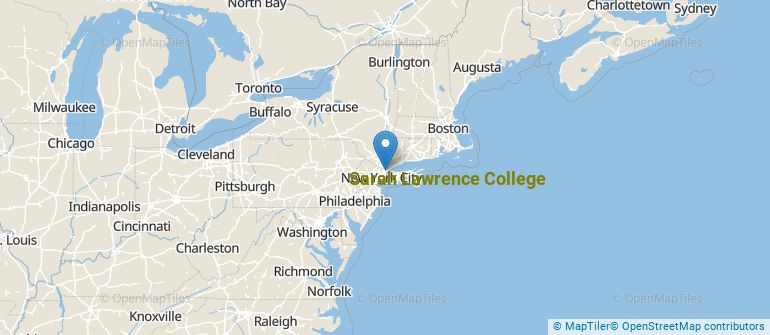
Get more details about the location of Sarah Lawrence College.
Contact details for Sarah Lawrence are given below.
| Contact Details | |
|---|---|
| Address: | One Meadway, Bronxville, NY 10708 |
| Phone: | 914-337-0700 |
| Website: | www.sarahlawrence.edu/ |
| Most Popular Majors | Bachelor’s Degrees | Average Salary of Graduates |
|---|---|---|
| Liberal Arts General Studies | 318 | $25,846 |
| Writing Studies | 41 | NA |
| Mental & Social Health Services | 24 | NA |
| Teacher Education Grade Specific | 8 | NA |
| Rehabilitation & Therapeutic Professions | 8 | NA |
| Other Social Sciences | 6 | NA |
| Drama & Theater Arts | 6 | NA |
| Dance | 4 | NA |
| Human Development & Family Studies | 2 | NA |
| Public Health | 0 | NA |
Footnotes
*The racial-ethnic minorities count is calculated by taking the total number of students and subtracting white students, international students, and students whose race/ethnicity was unknown. This number is then divided by the total number of students at the school to obtain the racial-ethnic minorities percentage.
References
More about our data sources and methodologies.