Sarah Lawrence total enrollment is approximately 1,506 students. 1,274 are undergraduates and 180 are graduate students.
Male/Female Breakdown of Undergraduates
The full-time Sarah Lawrence undergraduate population is made up of 76% women, and 24% men.
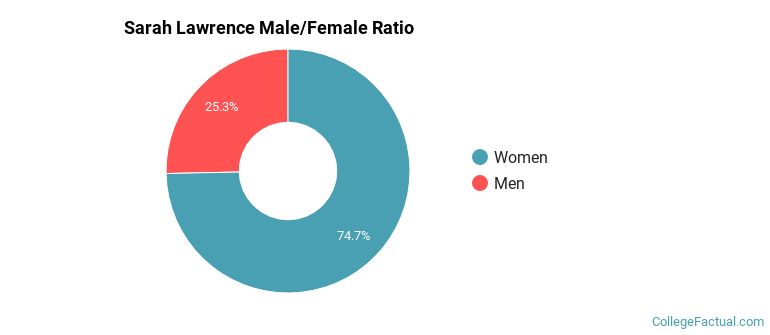
For the gender breakdown for all students, go here.
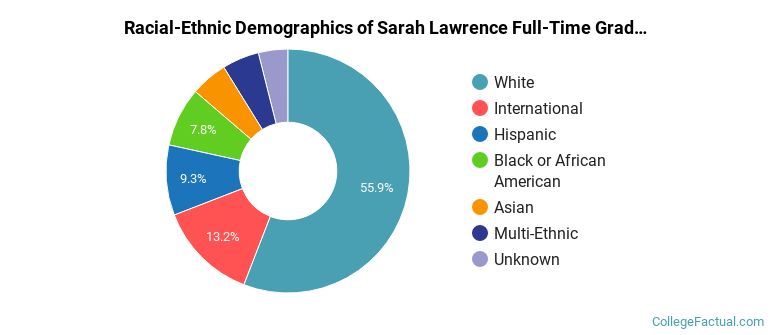
Sarah Lawrence Racial/Ethnic Breakdown of Undergraduates

| Race/Ethnicity | Number |
|---|---|
| White | 739 |
| Hispanic | 126 |
| International | 115 |
| Unknown | 110 |
| Multi-Ethnic | 68 |
| Black or African American | 60 |
| Asian | 56 |
| Native Hawaiian or Pacific Islander | 0 |
See racial/ethnic breakdown for all students.
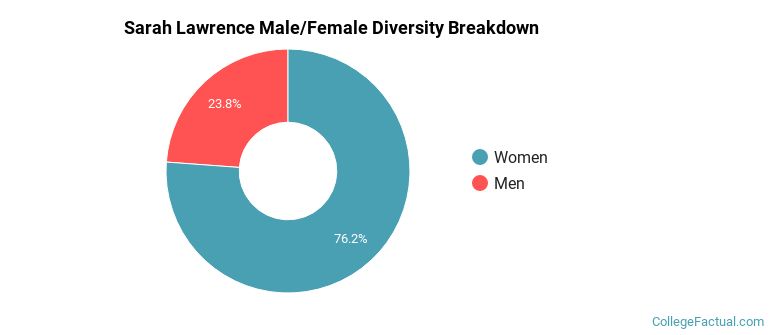
Male/Female Breakdown of Graduate Students
About 89% of full-time grad students are women, and 11% men.

For the gender breakdown for all students, go here.
Sarah Lawrence Racial-Ethnic Breakdown of Graduate Students
| Race/Ethnicity | Number |
|---|---|
| White | 90 |
| International | 29 |
| Unknown | 17 |
| Asian | 13 |
| Black or African American | 13 |
| Hispanic | 11 |
| Multi-Ethnic | 7 |
| Native Hawaiian or Pacific Islander | 0 |
See racial/ethnic breakdown for all students.

| Race/Ethnicity | Number |
|---|---|
| White | 864 |
| International | 144 |
| Hispanic | 140 |
| Unknown | 132 |
| Black or African American | 78 |
| Multi-Ethnic | 76 |
| Asian | 72 |
| Native Hawaiian or Pacific Islander | 0 |
There are approximately 1,176 female students and 330 male students at Sarah Lawrence.
Sarah Lawrence ranks 62 out of 2,183 when it comes to geographic diversity.
80.06% of Sarah Lawrence students come from out of state, and 17.24% come from out of the country.
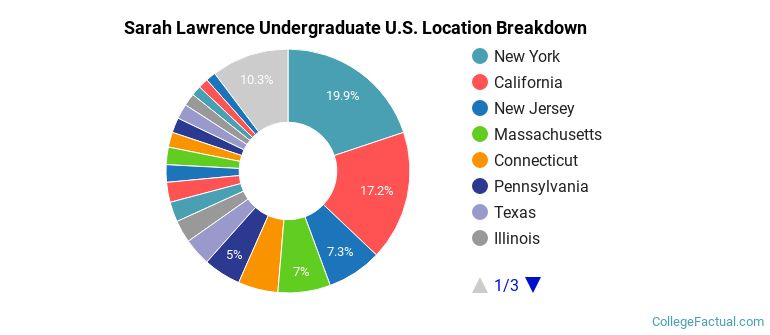
The undergraduate student body is split among 39 states (may include Washington D.C.). Click on the map for more detail.
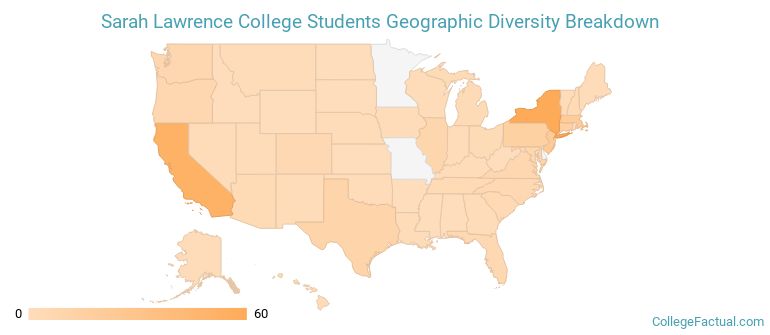
| State | Amount |
|---|---|
| New York | 60 |
| California | 52 |
| New Jersey | 22 |
| Massachusetts | 21 |
| Connecticut | 16 |
Students from 59 countries are represented at this school, with the majority of the international students coming from China, India, and Canada.
Learn more about international students at Sarah Lawrence.
A traditional college student is defined as being between the ages of 18-21. At Sarah Lawrence, 70.93% of students fall into that category, compared to the national average of 60%.
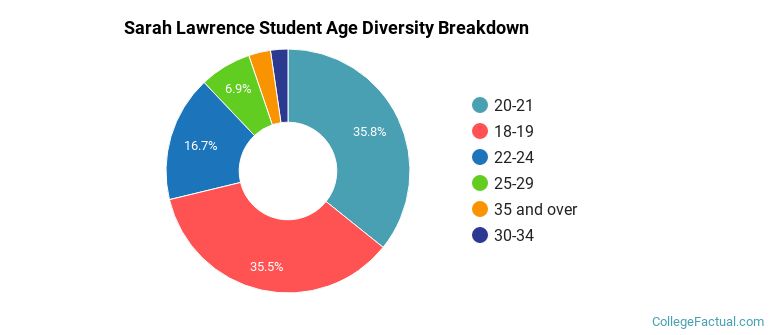
| Student Age Group | Amount |
|---|---|
| 20-21 | 604 |
| 18-19 | 599 |
| 22-24 | 282 |
| 25-29 | 116 |
| 35 and over | 49 |
| 30-34 | 39 |
| Under 18 | 0 |
Footnotes
*The racial-ethnic minorities count is calculated by taking the total number of students and subtracting white students, international students, and students whose race/ethnicity was unknown. This number is then divided by the total number of students at the school to obtain the racial-ethnic minorities percentage.
References
Department of Homeland Security Citizenship and Immigration Services
Read College Factual's Diversity Ranking Methodology.