SCAD total enrollment is approximately 14,265 students. 9,126 are undergraduates and 1,840 are graduate students.
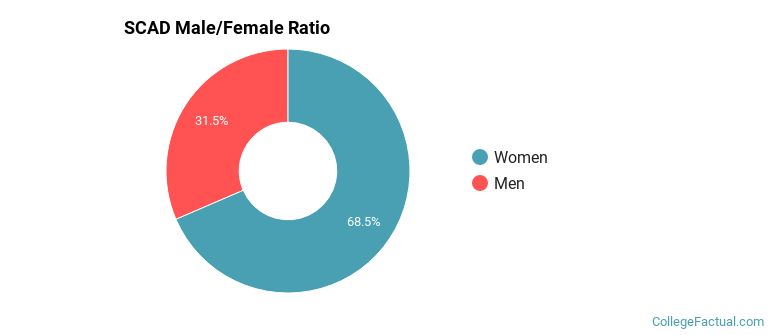
Male/Female Breakdown of Undergraduates
The full-time SCAD undergraduate population is made up of 69% women, and 31% men.
For the gender breakdown for all students, go here.
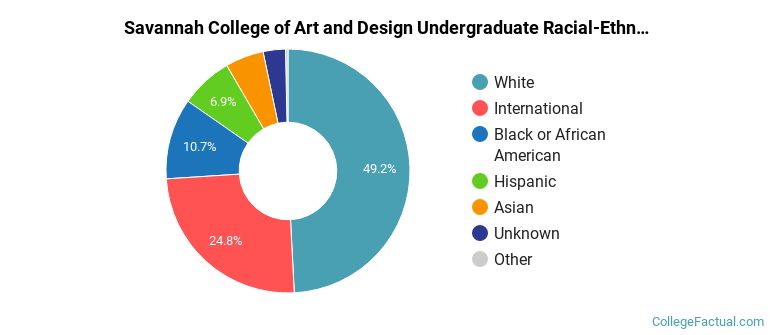
SCAD Racial/Ethnic Breakdown of Undergraduates
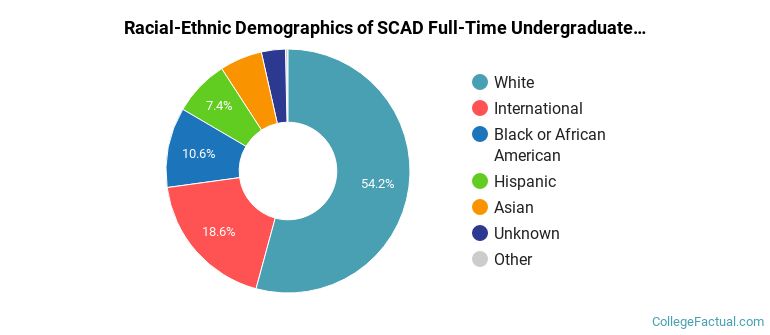
| Race/Ethnicity | Number |
|---|---|
| White | 4,657 |
| International | 1,784 |
| Black or African American | 1,074 |
| Hispanic | 631 |
| Asian | 511 |
| Unknown | 387 |
| Native Hawaiian or Pacific Islander | 21 |
| Multi-Ethnic | 0 |
See racial/ethnic breakdown for all students.
Male/Female Breakdown of Graduate Students
About 69% of full-time grad students are women, and 31% men.
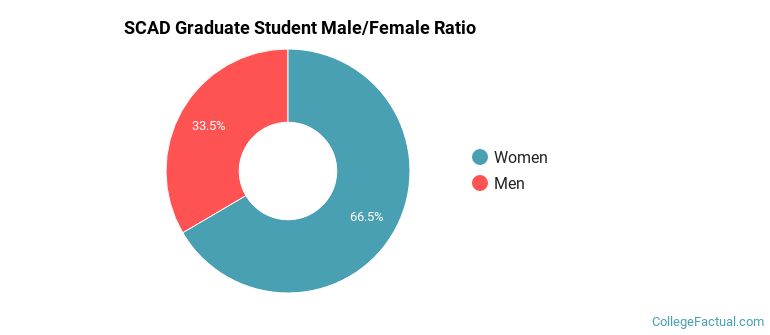
For the gender breakdown for all students, go here.
SCAD Racial-Ethnic Breakdown of Graduate Students
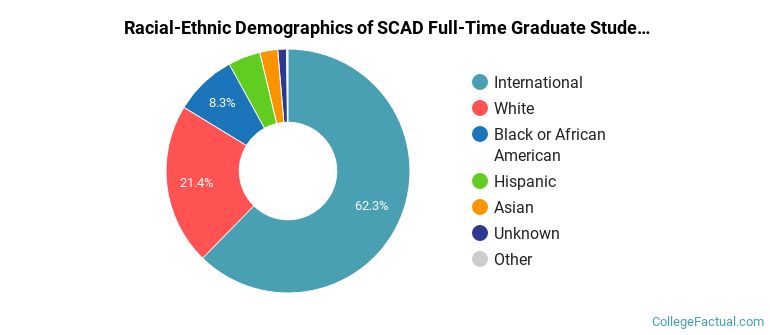
| Race/Ethnicity | Number |
|---|---|
| International | 1,094 |
| White | 420 |
| Black or African American | 166 |
| Hispanic | 74 |
| Asian | 51 |
| Unknown | 29 |
| Native Hawaiian or Pacific Islander | 2 |
| Multi-Ethnic | 0 |
See racial/ethnic breakdown for all students.
| Race/Ethnicity | Number |
|---|---|
| White | 6,705 |
| International | 3,617 |
| Black or African American | 1,615 |
| Hispanic | 943 |
| Asian | 725 |
| Unknown | 548 |
| Native Hawaiian or Pacific Islander | 33 |
| Multi-Ethnic | 1 |

There are approximately 9,787 female students and 4,478 male students at SCAD.
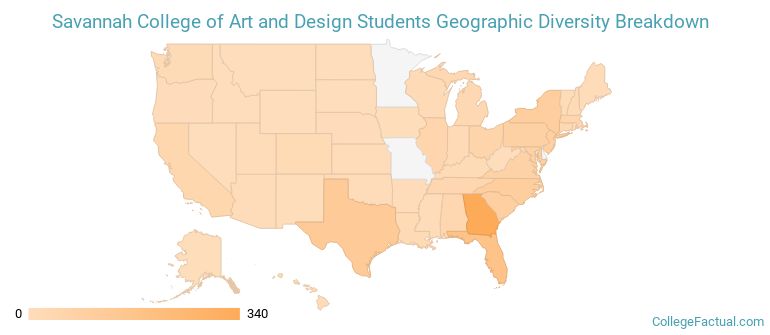
SCAD ranks 37 out of 2,183 when it comes to geographic diversity.
82% of SCAD students come from out of state, and 12.7% come from out of the country.
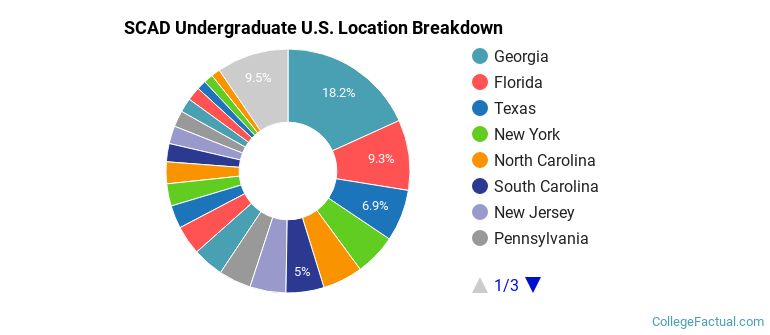
The undergraduate student body is split among 46 states (may include Washington D.C.). Click on the map for more detail.
| State | Amount |
|---|---|
| Georgia | 340 |
| Florida | 174 |
| Texas | 128 |
| New York | 103 |
| North Carolina | 99 |
Students from 115 countries are represented at this school, with the majority of the international students coming from China, India, and South Korea.
Learn more about international students at SCAD.
A traditional college student is defined as being between the ages of 18-21. At SCAD, 59.77% of students fall into that category, compared to the national average of 60%.
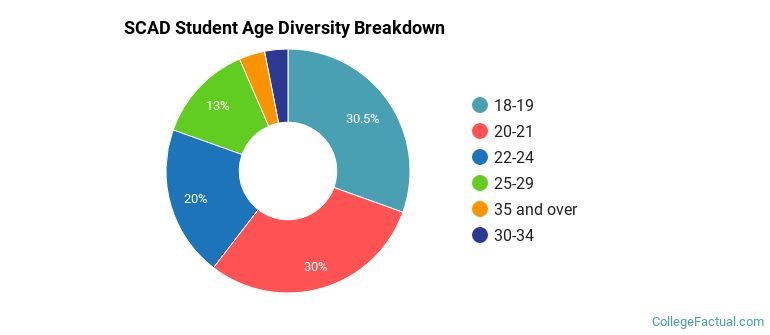
| Student Age Group | Amount |
|---|---|
| 18-19 | 3,968 |
| 20-21 | 3,899 |
| 22-24 | 2,606 |
| 25-29 | 1,696 |
| 35 and over | 445 |
| 30-34 | 402 |
| Under 18 | 0 |
Footnotes
*The racial-ethnic minorities count is calculated by taking the total number of students and subtracting white students, international students, and students whose race/ethnicity was unknown. This number is then divided by the total number of students at the school to obtain the racial-ethnic minorities percentage.
References
Department of Homeland Security Citizenship and Immigration Services
Image Credit: By Jeff Clemmons. under License