SVA total enrollment is approximately 3,692 students. 3,107 are undergraduates and 436 are graduate students.
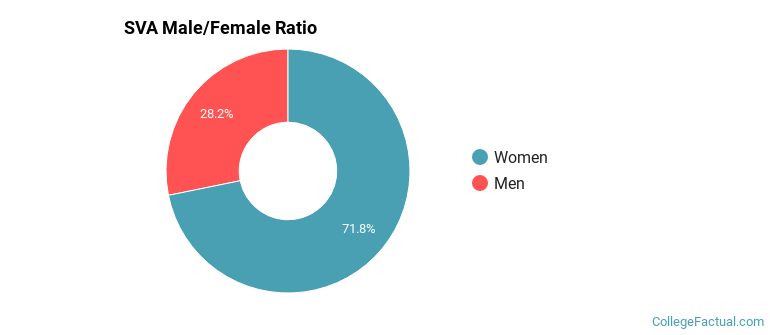
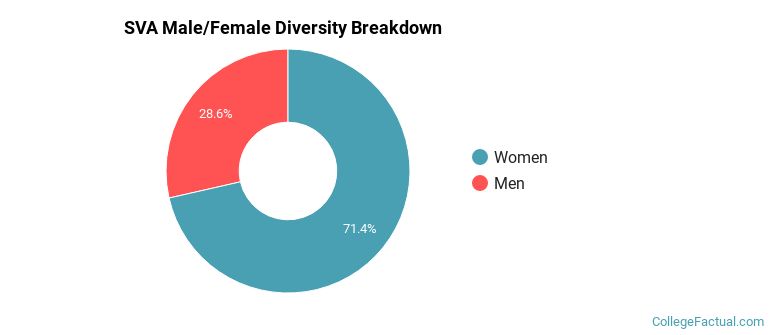
Male/Female Breakdown of Undergraduates
The full-time SVA undergraduate population is made up of 73% women, and 27% men.
For the gender breakdown for all students, go here.
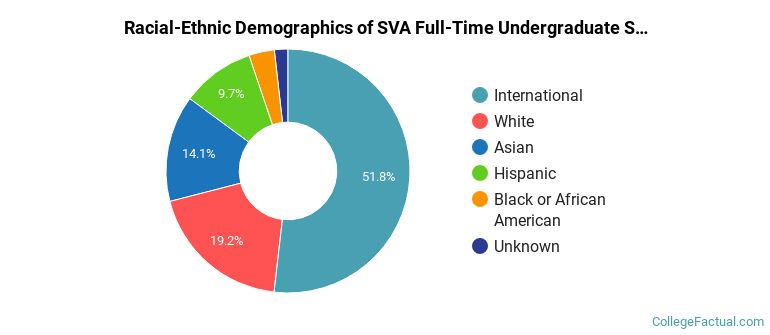
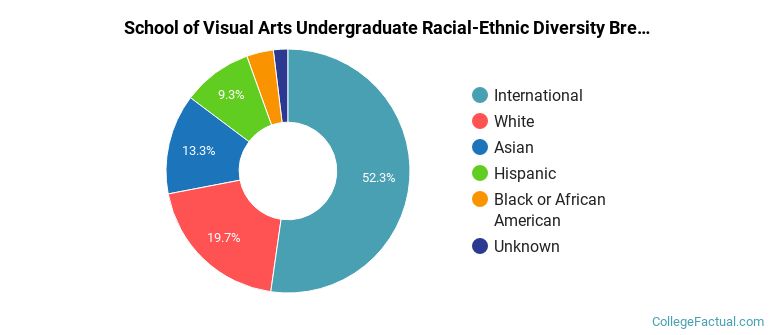
SVA Racial/Ethnic Breakdown of Undergraduates
| Race/Ethnicity | Number |
|---|---|
| International | 1,613 |
| White | 561 |
| Asian | 465 |
| Hispanic | 303 |
| Black or African American | 115 |
| Unknown | 50 |
| Native Hawaiian or Pacific Islander | 0 |
| Multi-Ethnic | 0 |
See racial/ethnic breakdown for all students.
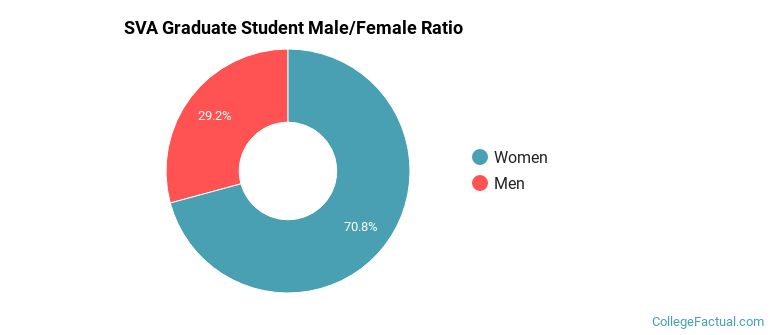
Male/Female Breakdown of Graduate Students
About 70% of full-time grad students are women, and 30% men.
For the gender breakdown for all students, go here.
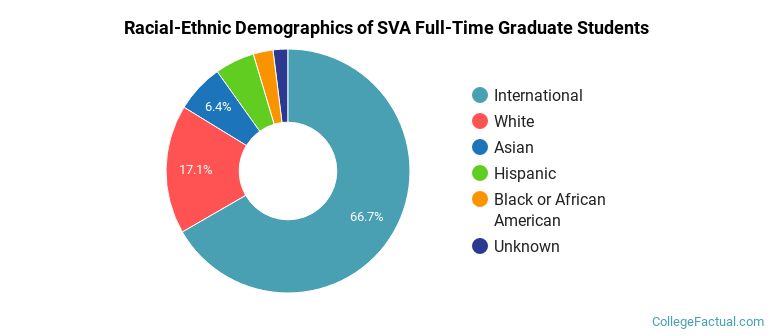
SVA Racial-Ethnic Breakdown of Graduate Students
| Race/Ethnicity | Number |
|---|---|
| International | 283 |
| White | 73 |
| Hispanic | 31 |
| Asian | 24 |
| Black or African American | 17 |
| Unknown | 8 |
| Native Hawaiian or Pacific Islander | 0 |
| Multi-Ethnic | 0 |
See racial/ethnic breakdown for all students.
| Race/Ethnicity | Number |
|---|---|
| International | 1,920 |
| White | 690 |
| Asian | 523 |
| Hispanic | 354 |
| Black or African American | 141 |
| Unknown | 64 |
| Native Hawaiian or Pacific Islander | 0 |
| Multi-Ethnic | 0 |
There are approximately 2,691 female students and 1,001 male students at SVA.
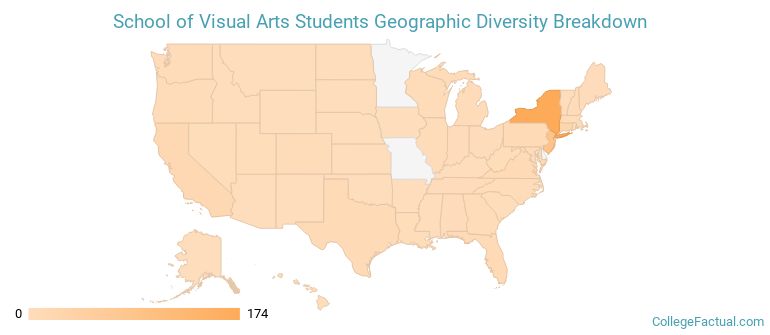
SVA ranks 194 out of 2,183 when it comes to geographic diversity.
57.77% of SVA students come from out of state, and 44.35% come from out of the country.
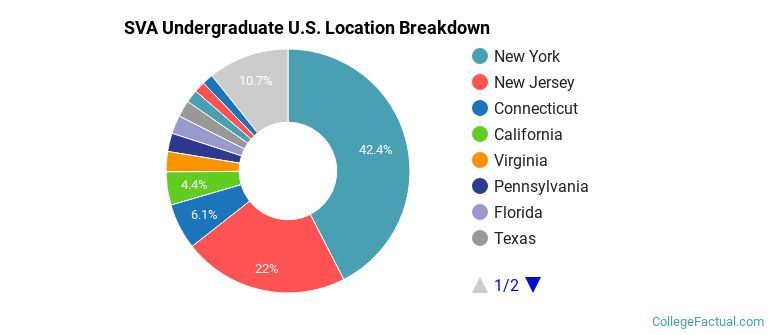
The undergraduate student body is split among 31 states (may include Washington D.C.). Click on the map for more detail.
| State | Amount |
|---|---|
| New York | 174 |
| New Jersey | 90 |
| Connecticut | 25 |
| California | 18 |
| Virginia | 11 |
Students from 76 countries are represented at this school, with the majority of the international students coming from China, South Korea, and Taiwan.
Learn more about international students at SVA.
A traditional college student is defined as being between the ages of 18-21. At SVA, 58.91% of students fall into that category, compared to the national average of 60%.
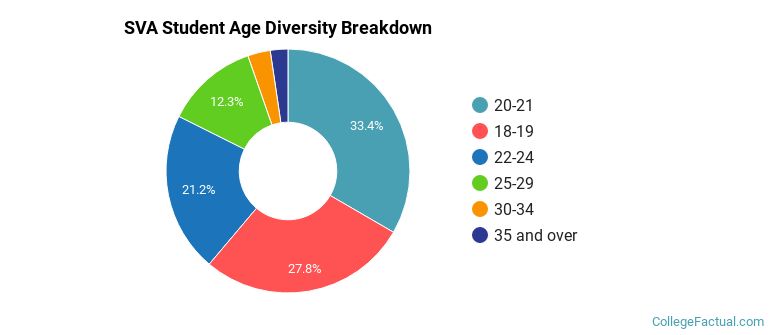
| Student Age Group | Amount |
|---|---|
| 20-21 | 1,412 |
| 18-19 | 1,176 |
| 22-24 | 897 |
| 25-29 | 520 |
| 30-34 | 127 |
| 35 and over | 99 |
| Under 18 | 0 |
Footnotes
*The racial-ethnic minorities count is calculated by taking the total number of students and subtracting white students, international students, and students whose race/ethnicity was unknown. This number is then divided by the total number of students at the school to obtain the racial-ethnic minorities percentage.
References