Below are the key facts about this program at Schoolcraft College. It is offered at the Associate’s, Undergraduate Certificate levels. Jump to any of the following sections:
Here is each degree level offered in entrepreneurial studies at Schoolcraft College, along with how many graduates complete each level annually.
| Degree Level | Annual Graduates |
|---|---|
| Associate’s | 12 |
| Undergraduate Certificate | 6 |
For the most recent IPEDS reporting year, Schoolcraft Community College District awarded 12 associate’s degrees in entrepreneurial studies.
Schoolcraft College is not yet ranked for entrepreneurial studies at the associate’s level.
Information about average full-time undergraduate tuition and fees is shown in the table below.
| In State | Out of State | |
|---|---|---|
| Tuition | $4,732 | $5,570 |
| Fees | $931 | $931 |
Learn more about Schoolcraft College tuition and fees.
Among recent graduates, 33% of entrepreneurial studies associate’s degrees went to men and 67% went to women.
 The majority of entrepreneurial studies associate’s degree graduates at Schoolcraft College are White. About 75% of graduates fell into this category.
The following table and chart show the ethnic background for students who recently graduated from Schoolcraft Community College District with a associate’s in entrepreneurial studies.

| Ethnic Background | Number of Students |
|---|---|
| Asian | 0 |
| Black or African American | 1 |
| Hispanic or Latino | 0 |
| White | 9 |
| Non-Resident Aliens | 0 |
| Other Races | 2 |
Schoolcraft College conferred 12 associate’s degrees in small business administration/management in the most recent reporting year — 67% to women and 33% to men. The most common background among these graduates was White (75%).
In the most recent year for which we have data, Schoolcraft Community College District awarded 6 undergraduate certificate degrees in entrepreneurial studies.
Schoolcraft College has not been ranked for entrepreneurial studies at the undergraduate certificate level.
For the most recent academic year available, 33% of entrepreneurial studies undergraduate certificate degrees went to men and 67% went to women.
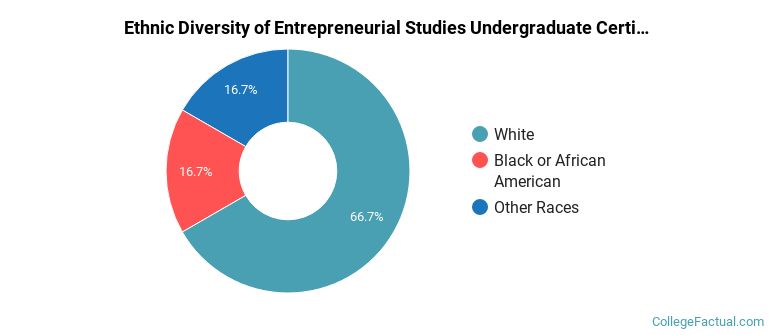
 The majority of entrepreneurial studies undergraduate certificate degree graduates at Schoolcraft College are White. Approximately 67% of graduates fell into this category.
The following table and chart show the ethnic background for students who recently graduated from Schoolcraft Community College District with a undergraduate certificate in entrepreneurial studies.
| Ethnic Background | Number of Students |
|---|---|
| Asian | 0 |
| Black or African American | 1 |
| Hispanic or Latino | 0 |
| White | 4 |
| Non-Resident Aliens | 0 |
| Other Races | 1 |
Schoolcraft College awarded 6 undergraduate certificate completions in small business administration/management recently — 67% to women and 33% to men. The most common background among these graduates was White (67%).
More about our data sources and methodologies.