Seattle U total enrollment is approximately 7,050 students. 4,045 are undergraduates and 1,585 are graduate students.
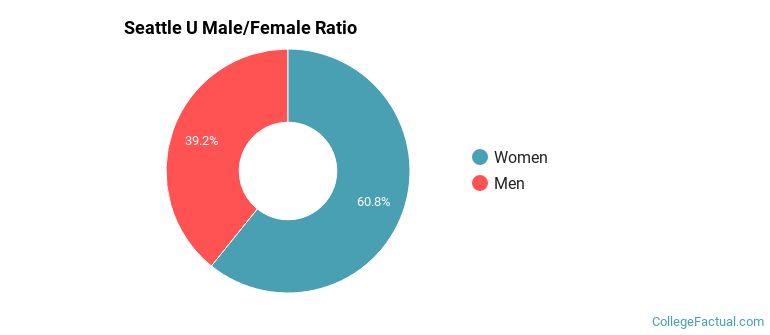
Male/Female Breakdown of Undergraduates
The full-time Seattle U undergraduate population is made up of 60% women, and 40% men.
For the gender breakdown for all students, go here.
Seattle U Racial/Ethnic Breakdown of Undergraduates
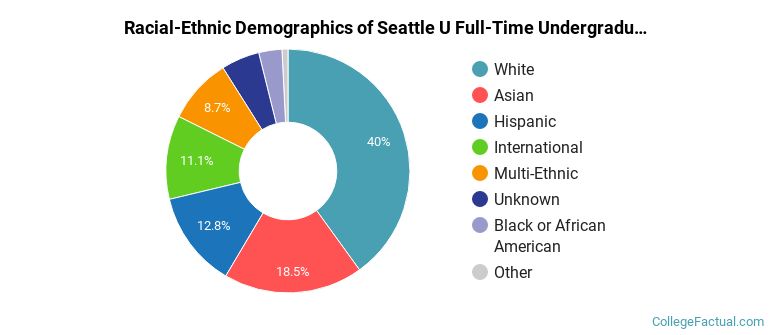
| Race/Ethnicity | Number |
|---|---|
| White | 1,583 |
| Asian | 849 |
| Hispanic | 533 |
| International | 392 |
| Multi-Ethnic | 376 |
| Black or African American | 137 |
| Unknown | 128 |
| Native Hawaiian or Pacific Islander | 42 |
See racial/ethnic breakdown for all students.
Male/Female Breakdown of Graduate Students
About 68% of full-time grad students are women, and 32% men.

For the gender breakdown for all students, go here.
Seattle U Racial-Ethnic Breakdown of Graduate Students
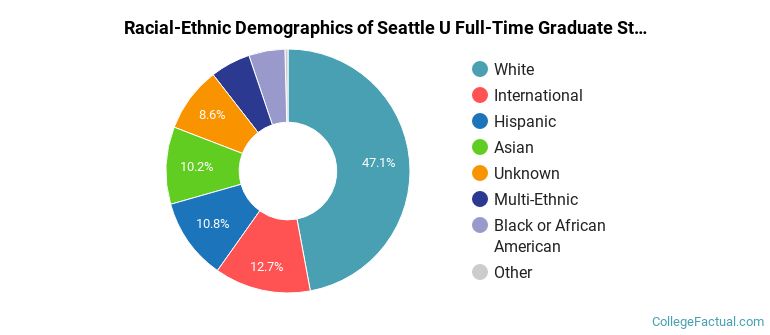
| Race/Ethnicity | Number |
|---|---|
| White | 812 |
| Asian | 201 |
| Hispanic | 168 |
| International | 125 |
| Multi-Ethnic | 98 |
| Black or African American | 85 |
| Unknown | 79 |
| Native Hawaiian or Pacific Islander | 7 |
See racial/ethnic breakdown for all students.
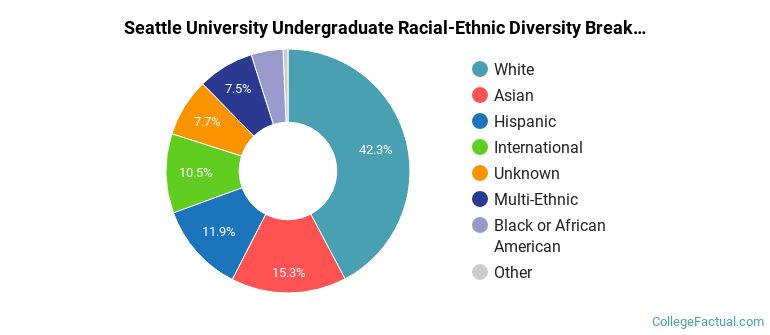
| Race/Ethnicity | Number |
|---|---|
| White | 3,010 |
| Asian | 1,226 |
| Hispanic | 836 |
| International | 669 |
| Multi-Ethnic | 567 |
| Black or African American | 330 |
| Unknown | 326 |
| Native Hawaiian or Pacific Islander | 58 |
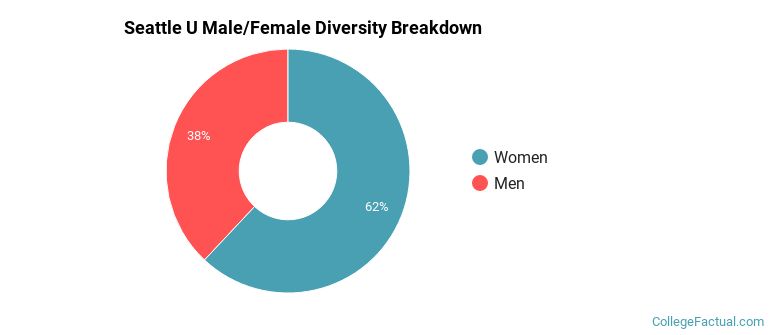
There are approximately 4,404 female students and 2,646 male students at Seattle U.
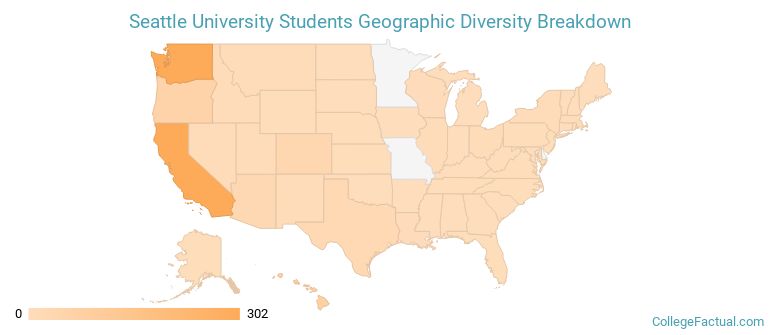
Seattle U ranks 176 out of 2,183 when it comes to geographic diversity.
67.97% of Seattle U students come from out of state, and 2.84% come from out of the country.
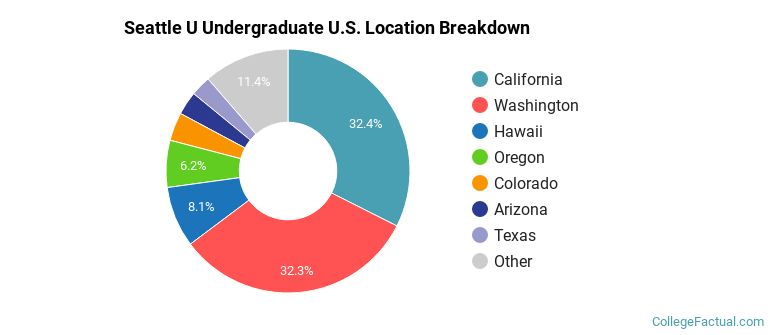
The undergraduate student body is split among 34 states (may include Washington D.C.). Click on the map for more detail.
| State | Amount |
|---|---|
| California | 302 |
| Washington | 301 |
| Hawaii | 75 |
| Oregon | 58 |
| Colorado | 35 |
Students from 72 countries are represented at this school, with the majority of the international students coming from China, Indonesia, and Vietnam.
Learn more about international students at Seattle U.
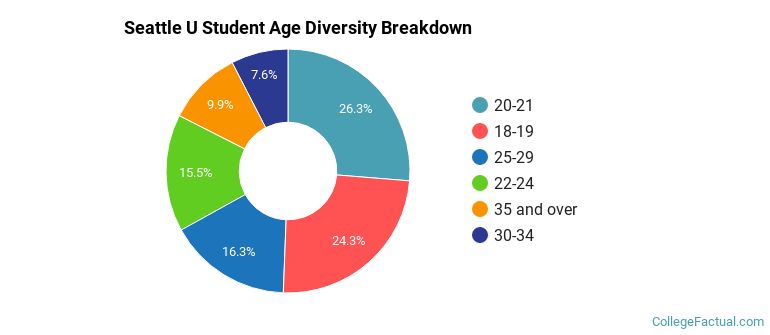
A traditional college student is defined as being between the ages of 18-21. At Seattle U, 50.03% of students fall into that category, compared to the national average of 60%.
| Student Age Group | Amount |
|---|---|
| 20-21 | 1,891 |
| 18-19 | 1,750 |
| 25-29 | 1,176 |
| 22-24 | 1,117 |
| 35 and over | 715 |
| 30-34 | 545 |
| Under 18 | 0 |
Footnotes
*The racial-ethnic minorities count is calculated by taking the total number of students and subtracting white students, international students, and students whose race/ethnicity was unknown. This number is then divided by the total number of students at the school to obtain the racial-ethnic minorities percentage.
References
Department of Homeland Security Citizenship and Immigration Services
Find out how College Factual created their Diversity Rankings.