Here is an overview of this program at Seton Hall University. You can study it at the Bachelor’s level, with graduate study also available. It ranks as high as #12 out of 22 schools (Bachelor’s level) by College Factual. Jump to any of the following sections:
By College Factual’s measure, Seton Hall University among the top schools in the country for criminal justice & corrections, ranked #283 out of 1,112 schools nationally.
| Ranking | Rank |
|---|---|
| Best Criminal Justice & Corrections Schools | 283 of 1,112 |
| Best Criminal Justice & Corrections Schools in New Jersey | 14 of 39 |
| Best Criminal Justice & Corrections Schools in the Middle Atlantic Region | 58 of 190 |
The following degree levels are granted in criminal justice & corrections at Seton Hall University, along with how many graduates complete each level annually.
| Degree Level | Annual Graduates |
|---|---|
| Bachelor’s | 42 |
| Master’s | 1 |
During the most recent reporting year, Seton Hall University conferred 42 bachelor’s degrees in criminal justice & corrections.
Seton Hall University is a solid choice among schools offering criminal justice & corrections at the bachelor’s level. Specifically, it ranked #12 out of 22 schools by College Factual.
Criminal Justice & Corrections students who finish a bachelor’s at Seton Hall University report a median salary of $52,453 a year. This is below $81,654, the median for all majors at Seton Hall University.
To complete a bachelor’s at Seton Hall University, criminal justice & corrections graduates take on a median debt of $23,250 in student loans. This is lower than $23,428, the typical median for all majors at Seton Hall University.

The full-time undergraduate tuition and fees are shown below.
| In State | Out of State | |
|---|---|---|
| Tuition | $44,420 | $50,380 |
| Fees | $2,790 | $2,790 |
Learn more about Seton Hall University tuition and fees.
In the most recent graduating class, 33% of criminal justice & corrections bachelor’s degrees went to men and 67% went to women.
 The largest share of criminal justice & corrections bachelor’s degree graduates at Seton Hall University are Hispanic or Latino. Roughly 40% of graduates fell into this category.
The following table and chart show the ethnic background for students who recently graduated from Seton Hall University with a bachelor’s in criminal justice & corrections.
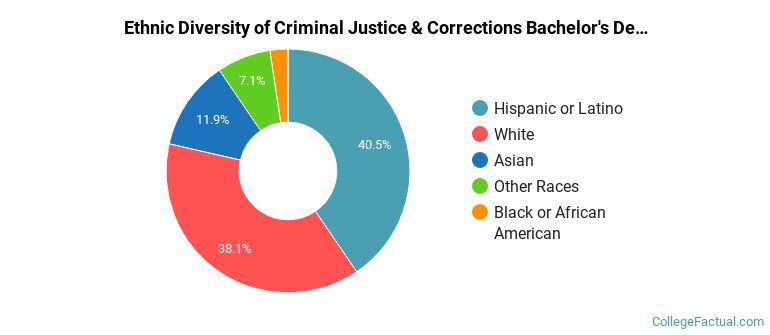
| Ethnic Background | Number of Students |
|---|---|
| Asian | 5 |
| Black or African American | 1 |
| Hispanic or Latino | 17 |
| White | 16 |
| Non-Resident Aliens | 0 |
| Other Races | 3 |
Seton Hall University conferred 42 bachelor’s completions in criminal justice/safety studies recently — 67% to women and 33% to men. Most of these graduates identified as Hispanic or Latino (40%).
You can also pursue this field at the graduate level at Seton Hall University. The following graduate award levels are reported.
| Graduate Level | Annual Graduates |
|---|---|
| Master’s Degrees in Criminal Justice & Corrections | 1 |
