
College Factual analyzes over 2,000 colleges and universities in its annual rankings and ranks them in a variety of ways, including most diverse, best overall quality, best for non-traditional students, and much more.
Shenandoah University was awarded 18 badges in the 2025 rankings. The highest ranked major at the school is rehabilitation & therapeutic professions.
Explore the best ranked schools for the programs you are most interested in.
College Factual ranked Shenandoah as #337 out of 2,152 colleges and universities in the country on its 2025 Best Colleges list. This puts it in the top 20% of all schools in the nation.
Shenandoah also holds the #13 spot on the Best Colleges in Virginia ranking.
The acceptance rate at Shenandoah University is 80%. That's higher than the rate at many schools, but still low enough to be considered somewhat selective. If you want to get in, you'll need good grades and to be able to show that Shenandoah is a good fit for you.
The student to faculty ratio at Shenandoah is an impressive 11 to 1. That's quite good when you compare it to the national average of 15 to 1. This is a good sign that students at the school will have more opportunities for one-on-one interactions with their professors.
Another measure that is often used to estimate how much access students will have to their professors is how many faculty members are full-time. The idea here is that part-time faculty tend to spend less time on campus, so they may not be as available to students as full-timers.
The full-time faculty percentage at Shenandoah University is 59%. This is higher than the national average of 47%.
Shenandoah University has a freshmen retention rate of 83%. That's a good sign that full-time students like the school and their professors enough to want to stick around for another year. It's also a sign that the admissions team did a good job in choosing applicants who were a good fit for the school.
Students are considered to have graduated on time if they finish their studies within four years. At Shenandoah the on-time graduation rate of first-time, full-time students is 46%. That is great when compared to the national average of 33.3%
Find out more about the retention and graduation rates at Shenandoah University.
During the 2017-2018 academic year, there were 2,267 undergraduates at Shenandoah with 2,097 being full-time and 170 being part-time.
| $0-30 K | $30K-48K | $48-75 | $75-110K | $110K + |
|---|---|---|---|---|
| $20,893 | $20,594 | $24,435 | $32,049 | $29,951 |
The net price is calculated by adding tuition, room, board and other costs and subtracting financial aid.Note that the net price is typically less than the published for a school. For more information on the sticker price of Shenandoah, see our tuition and fees and room and board pages.
It's not uncommon for college students to take out loans to pay for school. In fact, almost 66% of students nationwide depend at least partially on loans. At Shenandoah, approximately 94% of students took out student loans averaging $8,974 a year. That adds up to $35,896 over four years for those students.
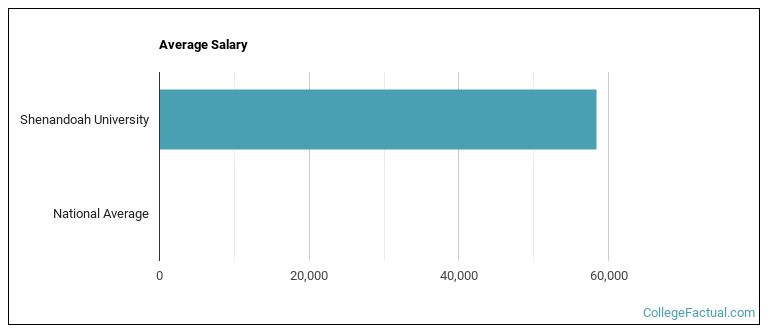
See which majors at Shenandoah University make the most money.
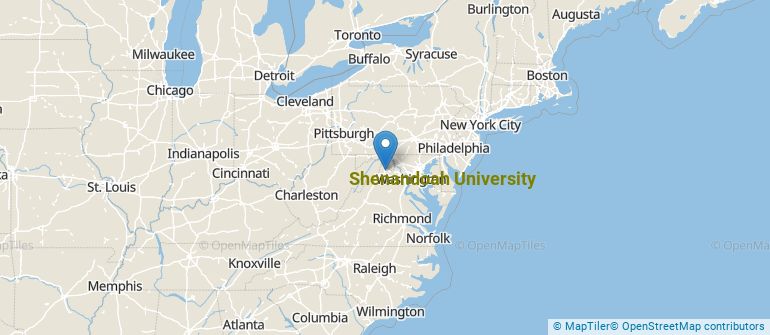
Get more details about the location of Shenandoah University.
Contact details for Shenandoah are given below.
| Contact Details | |
|---|---|
| Address: | 1460 University Dr, Winchester, VA 22601-5195 |
| Phone: | 540-665-4500 |
| Website: | www.su.edu/ |
| Most Popular Majors | Bachelor’s Degrees | Average Salary of Graduates |
|---|---|---|
| Nursing | 207 | $81,678 |
| Rehabilitation & Therapeutic Professions | 175 | NA |
| Business Administration & Management | 153 | $45,499 |
| Pharmacy/Pharmaceutical Sciences | 152 | NA |
| Human Services | 112 | NA |
| Allied Health Professions | 77 | NA |
| Music | 53 | NA |
| Physiology & Pathology Sciences | 40 | $24,058 |
| Teacher Education Subject Specific | 38 | $51,601 |
| General Biology | 37 | $40,980 |
Online learning is becoming popular at even the oldest colleges and universities in the United States. Not only are online classes great for returning adults with busy schedules, they are also frequented by a growing number of traditional students.
In 2022-2023, 1,569 students took at least one online class at Shenandoah University. This is a decrease from the 1,840 students who took online classes the previous year.
| Year | Took at Least One Online Class | Took All Classes Online |
|---|---|---|
| 2022-2023 | 1,569 | 558 |
| 2021-2022 | 1,840 | 699 |
| 2020-2021 | 2,131 | 1,128 |
| 2018-2019 | 1,050 | 417 |
If you’re considering Shenandoah University, here are some more schools you may be interested in knowing more about.
Curious on how these schools stack up against Shenandoah? Pit them head to head with College Combat, our free interactive tool that lets you compare college on the features that matter most to you!
Footnotes
*The racial-ethnic minorities count is calculated by taking the total number of students and subtracting white students, international students, and students whose race/ethnicity was unknown. This number is then divided by the total number of students at the school to obtain the racial-ethnic minorities percentage.
References
More about our data sources and methodologies.