Siena Heights University total enrollment is approximately 2,036 students. 1,123 are undergraduates and 67 are graduate students.
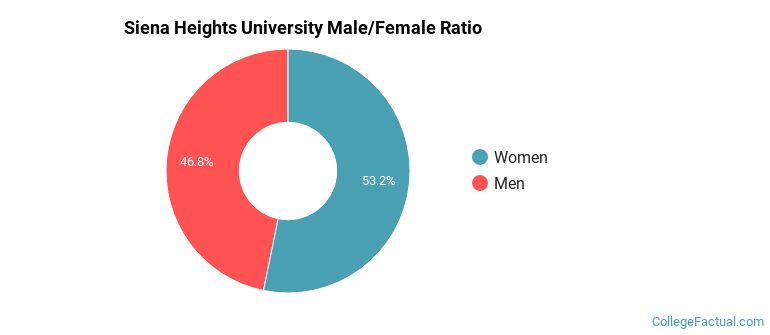
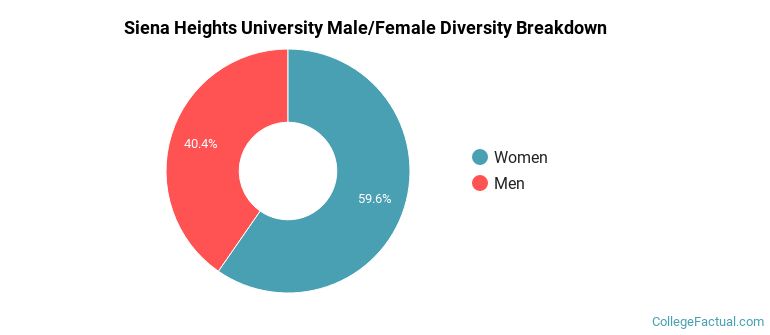
Male/Female Breakdown of Undergraduates
The full-time Siena Heights University undergraduate population is made up of 55% women, and 45% men.
For the gender breakdown for all students, go here.
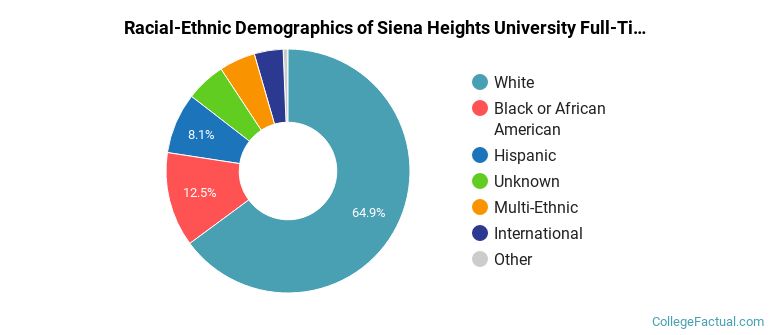
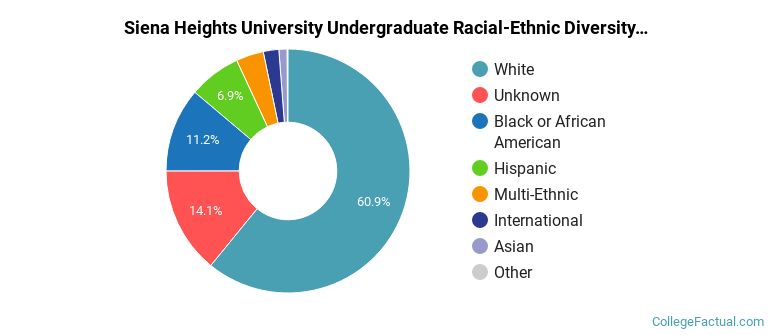
Siena Heights University Racial/Ethnic Breakdown of Undergraduates
| Race/Ethnicity | Number |
|---|---|
| White | 789 |
| Black or African American | 126 |
| Hispanic | 86 |
| Multi-Ethnic | 62 |
| Unknown | 43 |
| Asian | 10 |
| Native Hawaiian or Pacific Islander | 0 |
| International | 0 |
See racial/ethnic breakdown for all students.
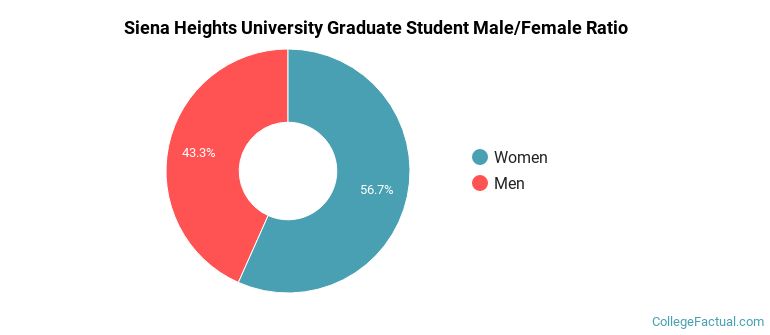
Male/Female Breakdown of Graduate Students
About 58% of full-time grad students are women, and 42% men.
For the gender breakdown for all students, go here.
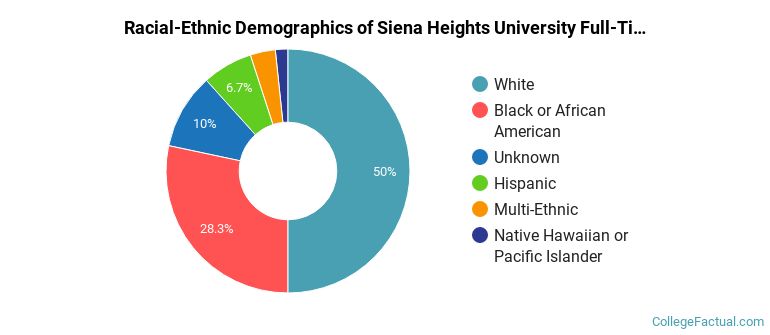
Siena Heights University Racial-Ethnic Breakdown of Graduate Students
| Race/Ethnicity | Number |
|---|---|
| White | 40 |
| Black or African American | 15 |
| Unknown | 7 |
| Hispanic | 2 |
| Multi-Ethnic | 2 |
| Asian | 1 |
| Native Hawaiian or Pacific Islander | 0 |
| International | 0 |
See racial/ethnic breakdown for all students.
| Race/Ethnicity | Number |
|---|---|
| White | 1,310 |
| Unknown | 262 |
| Black or African American | 211 |
| Hispanic | 134 |
| Multi-Ethnic | 88 |
| Asian | 20 |
| Native Hawaiian or Pacific Islander | 1 |
| International | 0 |
There are approximately 1,213 female students and 823 male students at Siena Heights University.
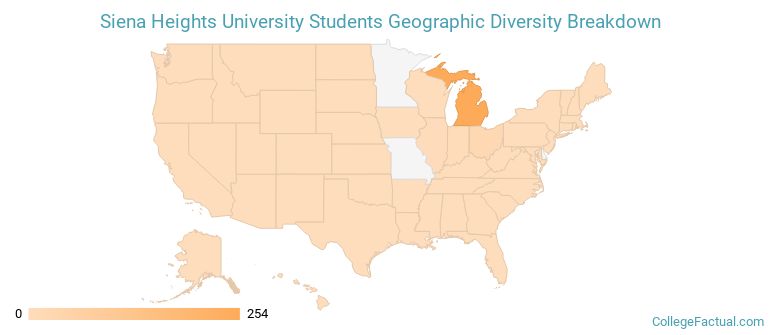
Siena Heights University ranks 1,565 out of 2,183 when it comes to geographic diversity.
11.81% of Siena Heights University students come from out of state, and 1.71% come from out of the country.
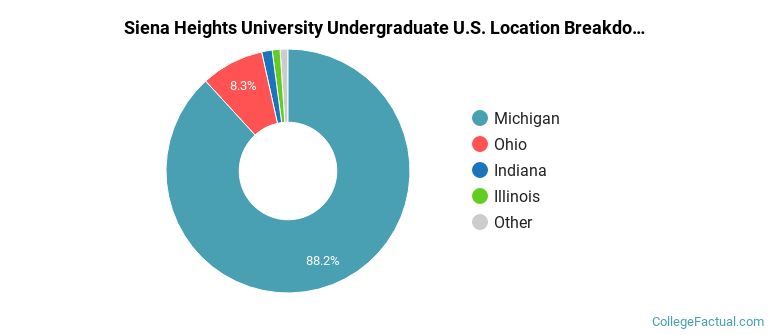
The undergraduate student body is split among 7 states (may include Washington D.C.). Click on the map for more detail.
| State | Amount |
|---|---|
| Michigan | 254 |
| Ohio | 24 |
| Indiana | 4 |
| Illinois | 3 |
| California | 1 |
A traditional college student is defined as being between the ages of 18-21. At Siena Heights University, 37.22% of students fall into that category, compared to the national average of 60%.
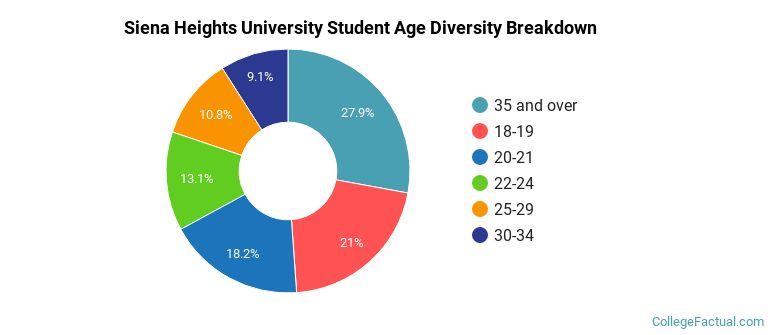
| Student Age Group | Amount |
|---|---|
| 35 and over | 653 |
| 18-19 | 491 |
| 20-21 | 426 |
| 22-24 | 307 |
| 25-29 | 252 |
| 30-34 | 212 |
| Under 18 | 0 |
Footnotes
*The racial-ethnic minorities count is calculated by taking the total number of students and subtracting white students, international students, and students whose race/ethnicity was unknown. This number is then divided by the total number of students at the school to obtain the racial-ethnic minorities percentage.
References
Department of Homeland Security Citizenship and Immigration Services
Image Credit: By Dwight Burdette under License
Read College Factual's Diversity Ranking Methodology.