Simmons total enrollment is approximately 6,263 students. 1,609 are undergraduates and 1,542 are graduate students.
Male/Female Breakdown of Undergraduates
The full-time Simmons undergraduate population is made up of 100% women, and 0% men.

For the gender breakdown for all students, go here.
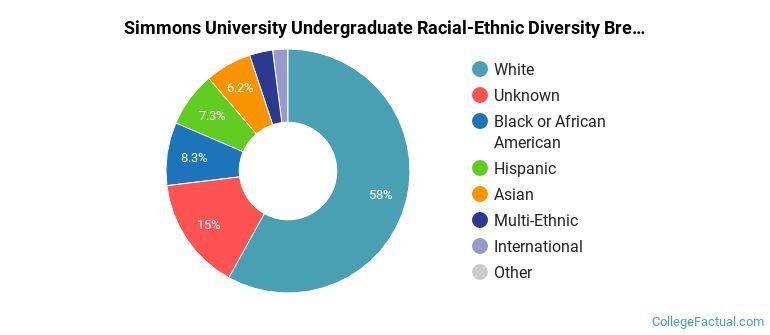
Simmons Racial/Ethnic Breakdown of Undergraduates

| Race/Ethnicity | Number |
|---|---|
| White | 925 |
| Asian | 198 |
| Hispanic | 189 |
| Black or African American | 116 |
| International | 86 |
| Multi-Ethnic | 68 |
| Unknown | 26 |
| Native Hawaiian or Pacific Islander | 0 |
See racial/ethnic breakdown for all students.
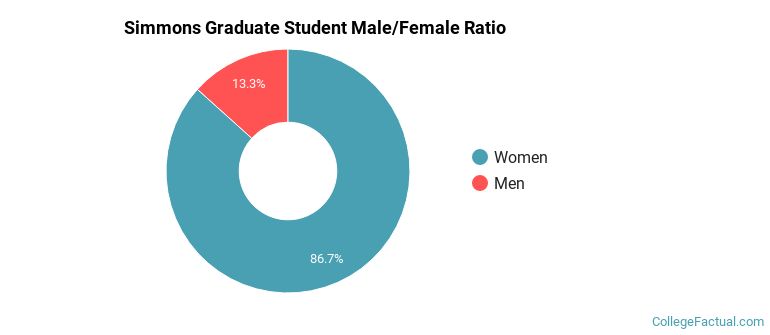
Male/Female Breakdown of Graduate Students
About 87% of full-time grad students are women, and 13% men.
For the gender breakdown for all students, go here.
Simmons Racial-Ethnic Breakdown of Graduate Students

| Race/Ethnicity | Number |
|---|---|
| White | 911 |
| Unknown | 292 |
| Black or African American | 125 |
| Hispanic | 111 |
| Asian | 51 |
| Multi-Ethnic | 35 |
| International | 17 |
| Native Hawaiian or Pacific Islander | 0 |
See racial/ethnic breakdown for all students.
| Race/Ethnicity | Number |
|---|---|
| White | 3,533 |
| Unknown | 1,016 |
| Hispanic | 518 |
| Black or African American | 503 |
| Asian | 384 |
| Multi-Ethnic | 178 |
| International | 126 |
| Native Hawaiian or Pacific Islander | 1 |

There are approximately 5,758 female students and 505 male students at Simmons.
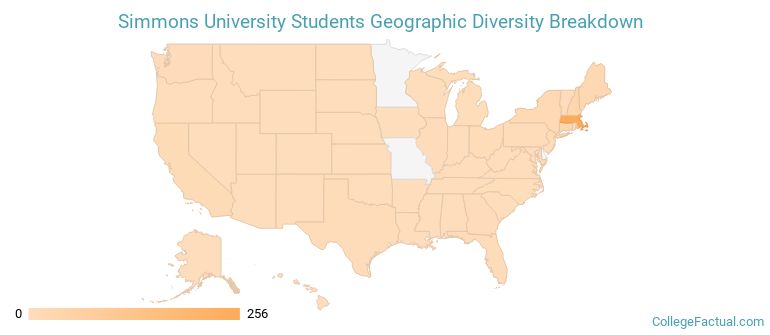
Simmons ranks 533 out of 2,183 when it comes to geographic diversity.
41.83% of Simmons students come from out of state, and 1.32% come from out of the country.
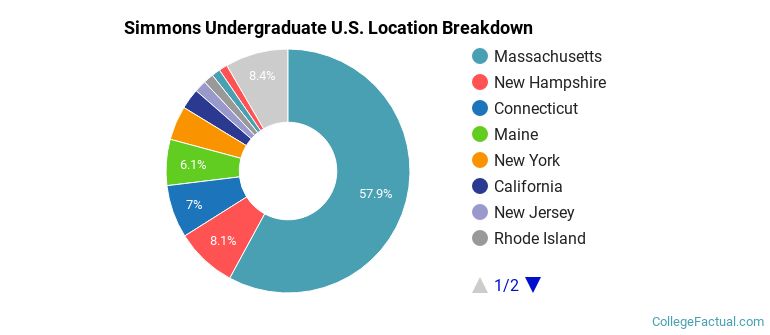
The undergraduate student body is split among 28 states (may include Washington D.C.). Click on the map for more detail.
| State | Amount |
|---|---|
| Massachusetts | 256 |
| New Hampshire | 36 |
| Connecticut | 31 |
| Maine | 27 |
| New York | 20 |
Students from 33 countries are represented at this school, with the majority of the international students coming from China, Saudi Arabia, and Vietnam.
Learn more about international students at Simmons.
A traditional college student is defined as being between the ages of 18-21. At Simmons, 22.66% of students fall into that category, compared to the national average of 60%.
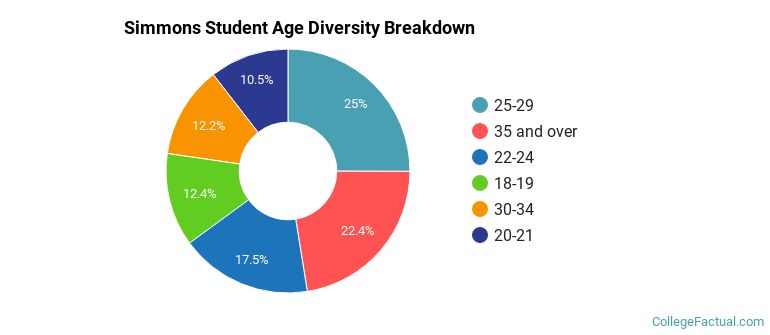
| Student Age Group | Amount |
|---|---|
| 25-29 | 1,561 |
| 35 and over | 1,397 |
| 22-24 | 1,089 |
| 18-19 | 770 |
| 30-34 | 761 |
| 20-21 | 654 |
| Under 18 | 0 |
Footnotes
*The racial-ethnic minorities count is calculated by taking the total number of students and subtracting white students, international students, and students whose race/ethnicity was unknown. This number is then divided by the total number of students at the school to obtain the racial-ethnic minorities percentage.
References