Here, you'll find out more about the major, including such details as the number of graduates, what degree levels are offered, ethnicity of students, and more. In addition, we cover how Sinclair Community College ranks in comparison to other schools with grade specific ed programs.
Go directly to any of the following sections:
The bachelor's program at Sinclair Community College was ranked #636 on College Factual's Best Schools for grade specific ed list.
In 2022-2023, the average part-time undergraduate tuition at Sinclair Community College was $318 per credit hour for out-of-state students. The average for in-state students was $162 per credit hour. The following table shows the average full-time tuition and fees for undergraduates.
| In State | Out of State | |
|---|---|---|
| Tuition | $3,889 | $7,636 |
| Fees | $680 | $680 |
| Books and Supplies | $624 | $624 |
Learn more about Sinclair Community College tuition and fees.
Sinclair Community College does not offer an online option for its grade specific ed bachelor’s degree program at this time. To see if the school offers distance learning options in other areas, visit the Sinclair Community College Online Learning page.
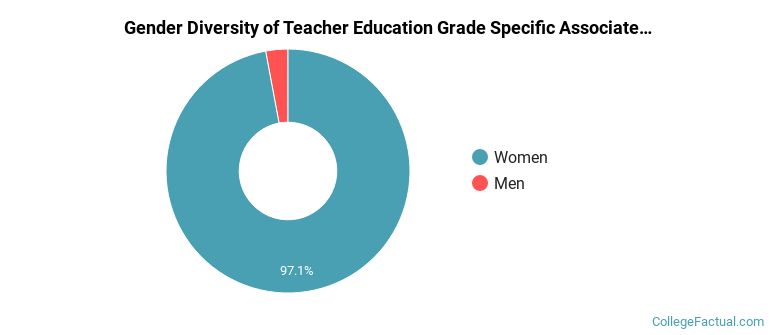
Of the 68 students who earned an associate's degree in Teacher Education Grade Specific from Sinclair Community College in 2021-2022, 3% were men and 97% were women.
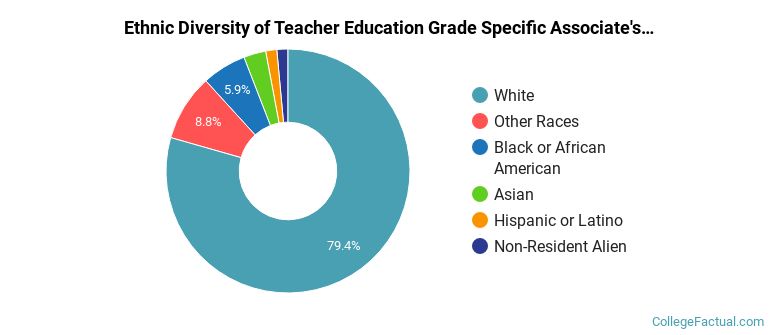
The majority of associate's degree recipients in this major at Sinclair Community College are white. In the most recent graduating class for which data is available, 79% of students fell into this category.
The following table and chart show the ethnic background for students who recently graduated from Sinclair Community College with a associate's in grade specific ed.
| Ethnic Background | Number of Students |
|---|---|
| Asian | 2 |
| Black or African American | 4 |
| Hispanic or Latino | 1 |
| White | 54 |
| Non-Resident Aliens | 1 |
| Other Races | 6 |
| Related Major | Annual Graduates |
|---|---|
| Teacher Education Subject Specific | 3 |