Skidmore total enrollment is approximately 2,582 students.
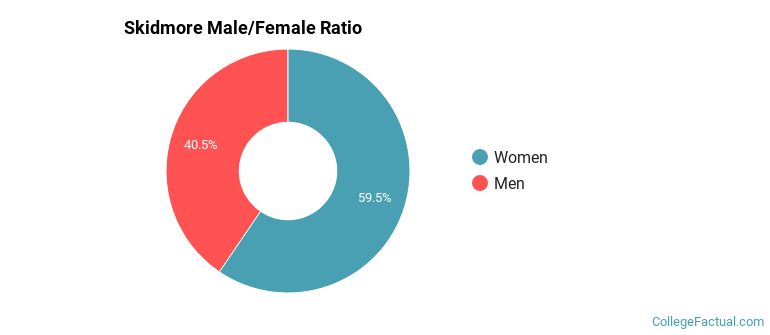
Male/Female Breakdown of Undergraduates
The full-time Skidmore undergraduate population is made up of 60% women, and 40% men.
For the gender breakdown for all students, go here.
Skidmore Racial/Ethnic Breakdown of Undergraduates
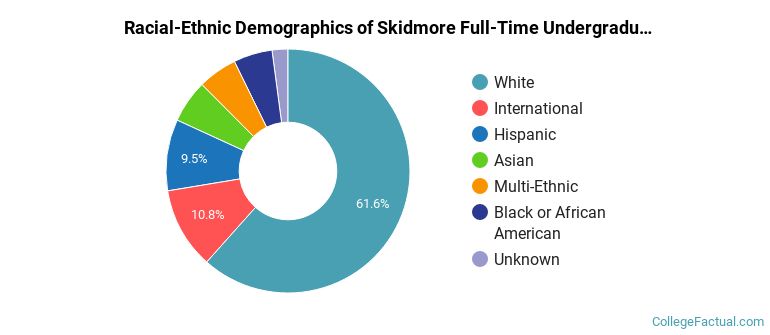
| Race/Ethnicity | Number |
|---|---|
| White | 1,536 |
| Hispanic | 256 |
| International | 253 |
| Black or African American | 141 |
| Asian | 139 |
| Multi-Ethnic | 130 |
| Unknown | 53 |
| Native Hawaiian or Pacific Islander | 1 |
See racial/ethnic breakdown for all students.
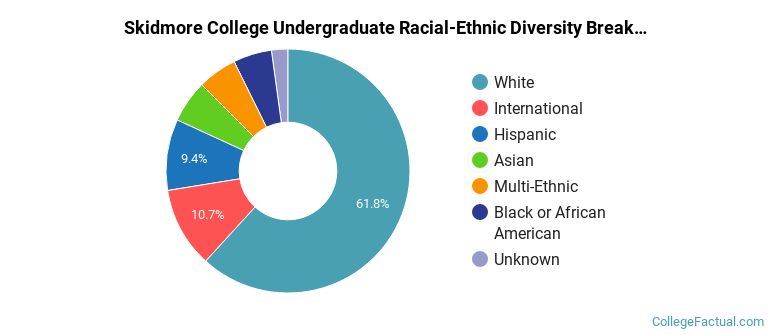
| Race/Ethnicity | Number |
|---|---|
| White | 1,588 |
| Hispanic | 261 |
| International | 258 |
| Black or African American | 144 |
| Asian | 140 |
| Multi-Ethnic | 134 |
| Unknown | 55 |
| Native Hawaiian or Pacific Islander | 1 |
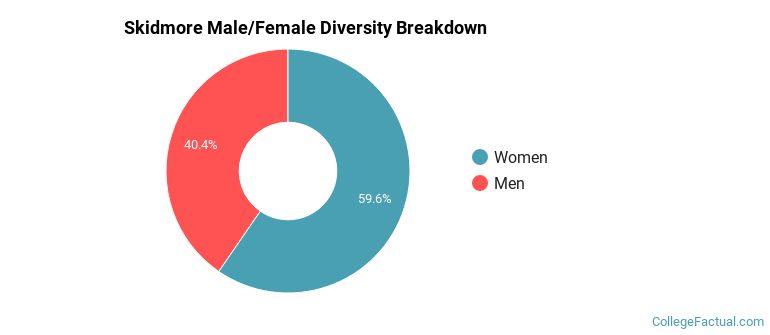
There are approximately 1,544 female students and 1,038 male students at Skidmore.
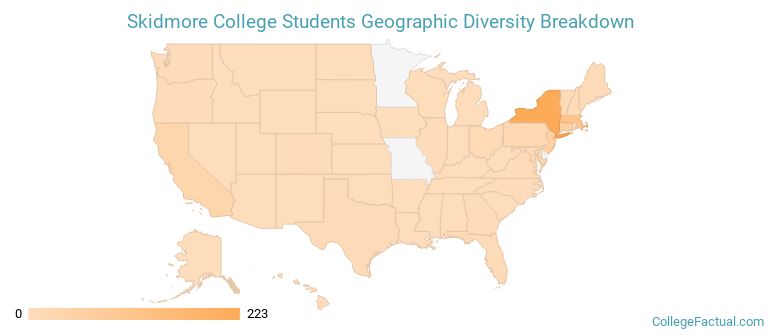
Skidmore ranks 257 out of 2,183 when it comes to geographic diversity.
64.88% of Skidmore students come from out of state, and 11.06% come from out of the country.
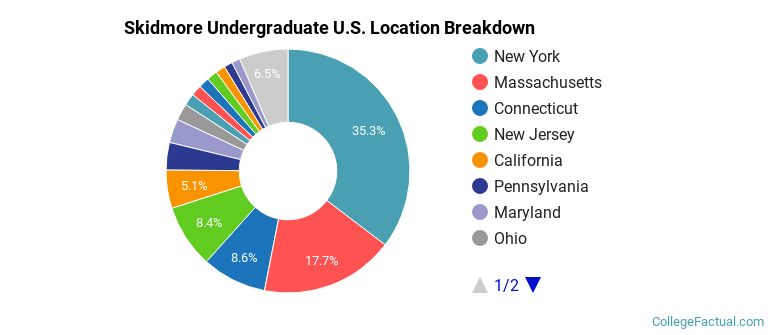
The undergraduate student body is split among 29 states (may include Washington D.C.). Click on the map for more detail.
| State | Amount |
|---|---|
| New York | 223 |
| Massachusetts | 112 |
| Connecticut | 54 |
| New Jersey | 53 |
| California | 32 |
Students from 73 countries are represented at this school, with the majority of the international students coming from China, Canada, and India.
Learn more about international students at Skidmore.
A traditional college student is defined as being between the ages of 18-21. At Skidmore, 90.98% of students fall into that category, compared to the national average of 60%.
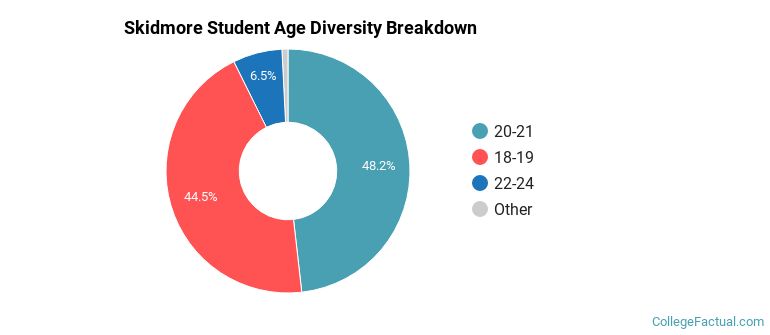
| Student Age Group | Amount |
|---|---|
| 20-21 | 1,270 |
| 18-19 | 1,172 |
| 22-24 | 172 |
| 35 and over | 10 |
| 25-29 | 6 |
| 30-34 | 5 |
| Under 18 | 0 |
Footnotes
*The racial-ethnic minorities count is calculated by taking the total number of students and subtracting white students, international students, and students whose race/ethnicity was unknown. This number is then divided by the total number of students at the school to obtain the racial-ethnic minorities percentage.
References
Department of Homeland Security Citizenship and Immigration Services
Read College Factual's Diversity Ranking Methodology.