SSU total enrollment is approximately 8,018 students. 6,419 are undergraduates and 392 are graduate students.
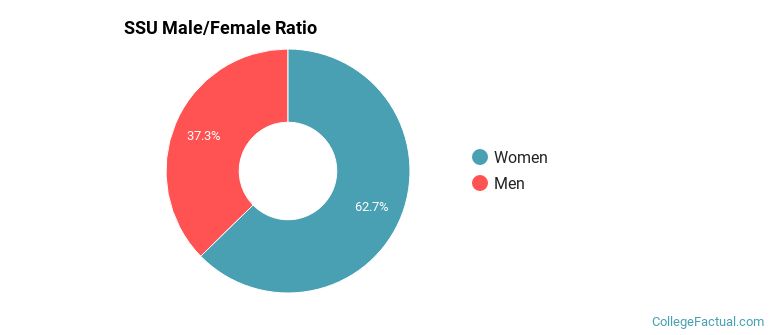
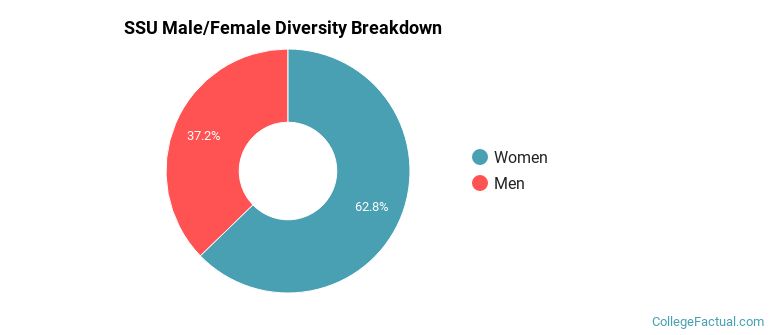
Male/Female Breakdown of Undergraduates
The full-time SSU undergraduate population is made up of 64% women, and 36% men.
For the gender breakdown for all students, go here.
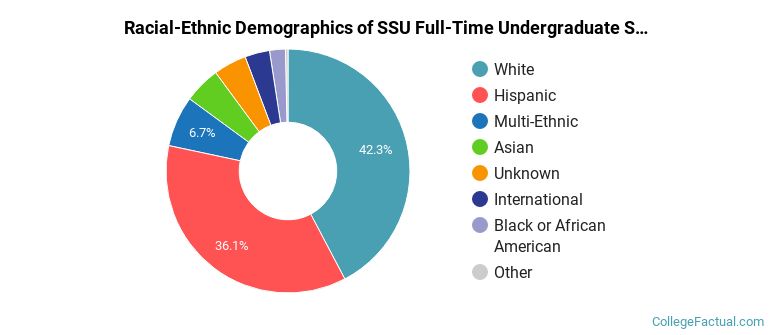
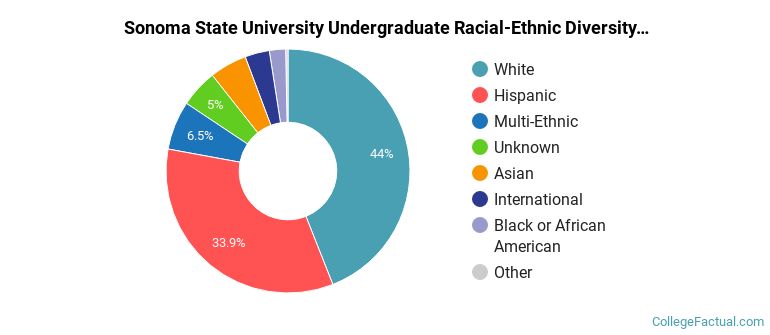
SSU Racial/Ethnic Breakdown of Undergraduates
| Race/Ethnicity | Number |
|---|---|
| White | 2,625 |
| Hispanic | 2,420 |
| Multi-Ethnic | 415 |
| Asian | 321 |
| Unknown | 233 |
| International | 208 |
| Black or African American | 152 |
| Native Hawaiian or Pacific Islander | 21 |
See racial/ethnic breakdown for all students.
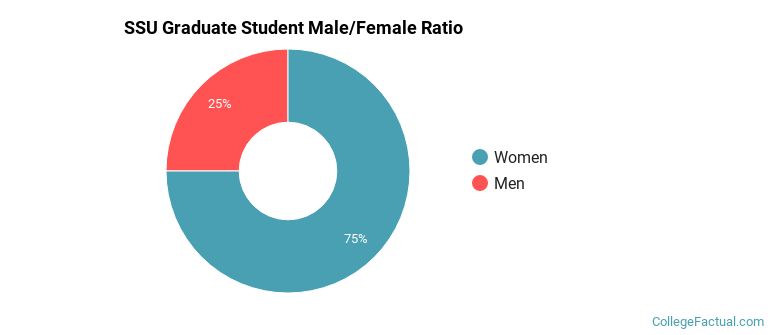
Male/Female Breakdown of Graduate Students
About 75% of full-time grad students are women, and 25% men.
For the gender breakdown for all students, go here.
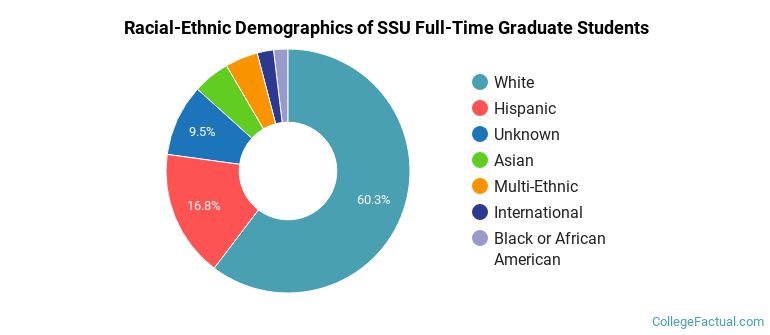
SSU Racial-Ethnic Breakdown of Graduate Students
| Race/Ethnicity | Number |
|---|---|
| White | 236 |
| Hispanic | 72 |
| Asian | 26 |
| Unknown | 20 |
| International | 14 |
| Multi-Ethnic | 13 |
| Black or African American | 10 |
| Native Hawaiian or Pacific Islander | 1 |
See racial/ethnic breakdown for all students.
| Race/Ethnicity | Number |
|---|---|
| White | 3,485 |
| Hispanic | 2,804 |
| Multi-Ethnic | 486 |
| Asian | 404 |
| Unknown | 347 |
| International | 249 |
| Black or African American | 191 |
| Native Hawaiian or Pacific Islander | 25 |
There are approximately 5,092 female students and 2,926 male students at SSU.
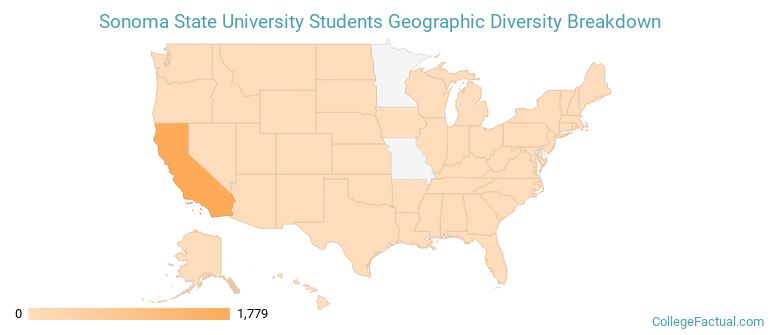
SSU ranks 1,668 out of 2,183 when it comes to geographic diversity.
1.33% of SSU students come from out of state, and 0.17% come from out of the country.
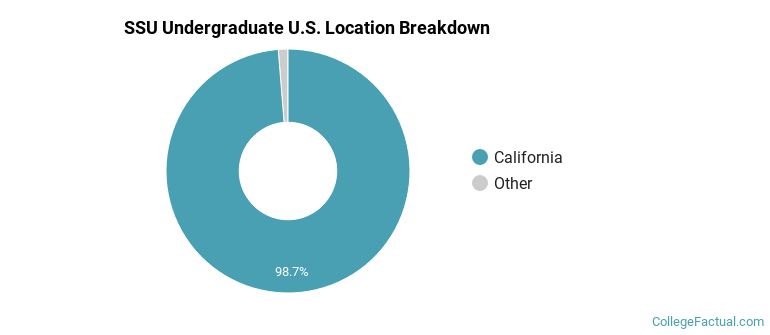
The undergraduate student body is split among 15 states (may include Washington D.C.). Click on the map for more detail.
| State | Amount |
|---|---|
| California | 1,779 |
| Hawaii | 4 |
| Oregon | 4 |
| Washington | 3 |
| Idaho | 2 |
Students from 34 countries are represented at this school, with the majority of the international students coming from Japan, China, and Germany.
Learn more about international students at SSU.
A traditional college student is defined as being between the ages of 18-21. At SSU, 62.46% of students fall into that category, compared to the national average of 60%.
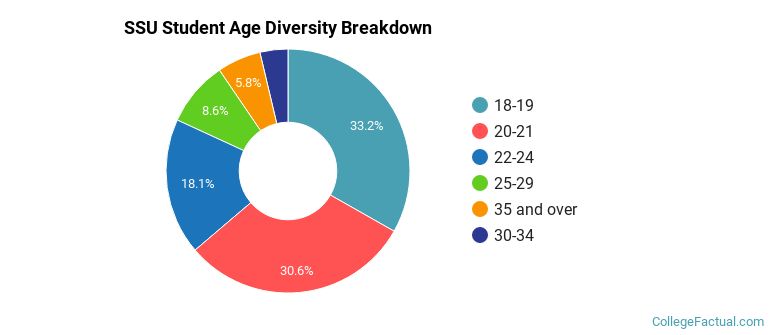
| Student Age Group | Amount |
|---|---|
| 18-19 | 3,084 |
| 20-21 | 2,838 |
| 22-24 | 1,680 |
| 25-29 | 801 |
| 35 and over | 539 |
| 30-34 | 344 |
| Under 18 | 0 |
Footnotes
*The racial-ethnic minorities count is calculated by taking the total number of students and subtracting white students, international students, and students whose race/ethnicity was unknown. This number is then divided by the total number of students at the school to obtain the racial-ethnic minorities percentage.
References