Below are the key facts about this program at South Dakota State University. Degrees are awarded at the Bachelor’s, Certificate levels. Jump to any of the following sections:
The table below lists every degree level granted in air transportation at South Dakota State University, along with how many graduates complete each level annually.
| Degree Level | Annual Graduates |
|---|---|
| Bachelor’s | 30 |
| Certificate | 3 |
During the most recent reporting year, South Dakota State University awarded 30 bachelor’s degrees in air transportation.
South Dakota State University is not yet ranked for air transportation at the bachelor’s level.
The full-time undergraduate tuition and fees are shown below.
| In State | Out of State | |
|---|---|---|
| Tuition | $7,773 | $11,283 |
| Fees | $1,526 | $1,526 |
Read more about South Dakota State University tuition and fees.
In the most recent graduating class, 90% of air transportation bachelor’s degrees went to men and 10% went to women.
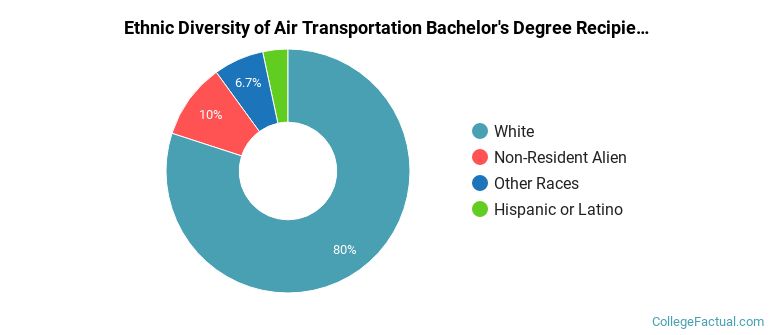
 The largest share of air transportation bachelor’s degree graduates at South Dakota State University are White. Approximately 80% of graduates fell into this category.
The following table and chart show the ethnic background for students who recently graduated from South Dakota State University with a bachelor’s in air transportation.
| Ethnic Background | Number of Students |
|---|---|
| Asian | 0 |
| Black or African American | 0 |
| Hispanic or Latino | 1 |
| White | 24 |
| Non-Resident Aliens | 3 |
| Other Races | 2 |
South Dakota State University granted 30 bachelor’s degrees in aeronautics/aviation/aerospace science and technology, general recently — 10% to women and 90% to men. Most of these graduates identified as White (80%).
In the most recent year for which we have data, South Dakota State University conferred 3 certificate degrees in air transportation.
South Dakota State University is not yet ranked for air transportation at the certificate level.
In the most recent graduating class, 67% of air transportation certificate degrees went to men and 33% went to women.
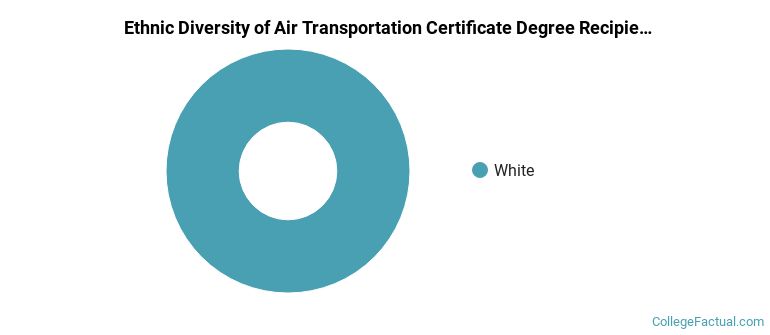
 The majority of air transportation certificate degree graduates at South Dakota State University were White. Roughly 100% of graduates fell into this category.
The following table and chart show the ethnic background for students who recently graduated from South Dakota State University with a certificate in air transportation.
| Ethnic Background | Number of Students |
|---|---|
| Asian | 0 |
| Black or African American | 0 |
| Hispanic or Latino | 0 |
| White | 3 |
| Non-Resident Aliens | 0 |
| Other Races | 0 |
South Dakota State University granted 3 certificate completions in remote aircraft pilot in the most recent reporting year — 33% to women and 67% to men. The most common background among these graduates was White (100%).