SEU total enrollment is approximately 9,546 students. 4,804 are undergraduates and 515 are graduate students.
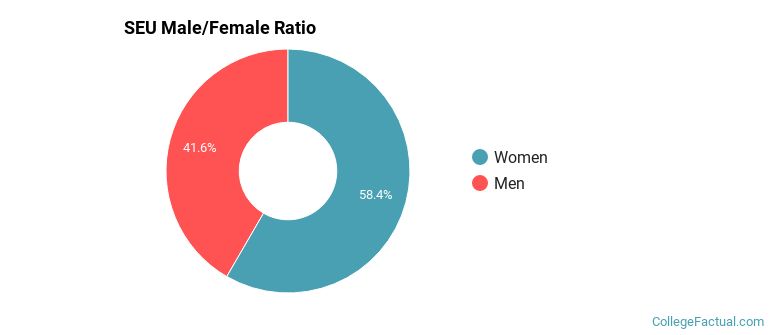
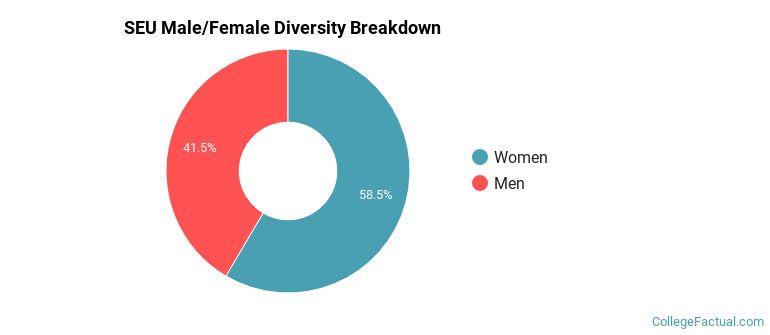
Male/Female Breakdown of Undergraduates
The full-time SEU undergraduate population is made up of 59% women, and 41% men.
For the gender breakdown for all students, go here.
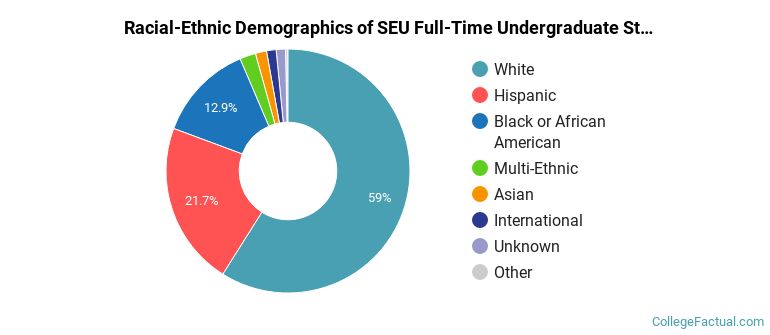
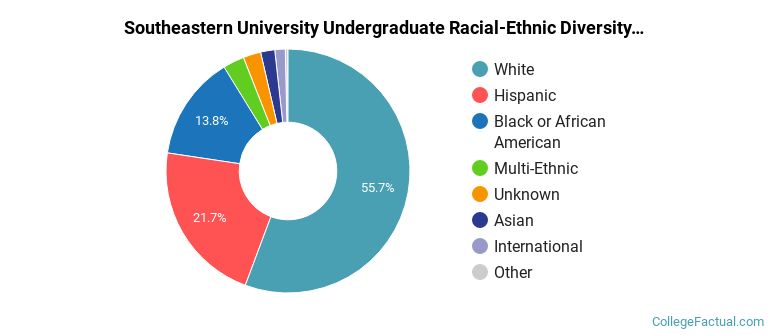
SEU Racial/Ethnic Breakdown of Undergraduates
| Race/Ethnicity | Number |
|---|---|
| White | 2,781 |
| Hispanic | 1,058 |
| Black or African American | 569 |
| Multi-Ethnic | 154 |
| Asian | 78 |
| International | 67 |
| Unknown | 45 |
| Native Hawaiian or Pacific Islander | 22 |
See racial/ethnic breakdown for all students.
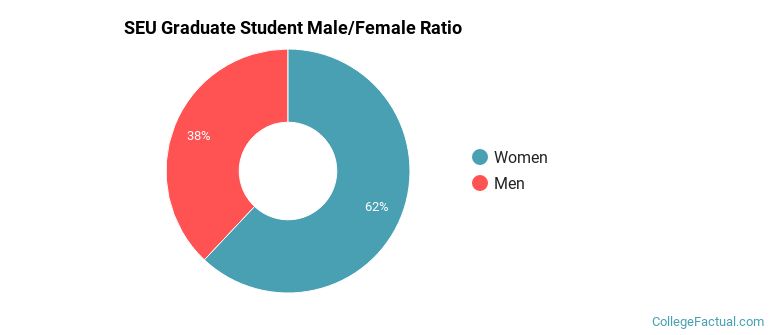
Male/Female Breakdown of Graduate Students
About 59% of full-time grad students are women, and 41% men.
For the gender breakdown for all students, go here.
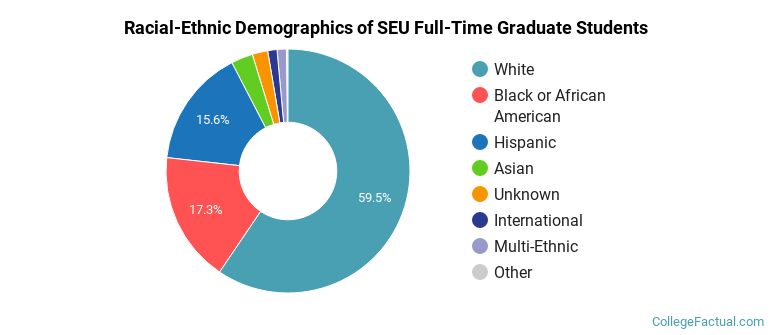
SEU Racial-Ethnic Breakdown of Graduate Students
| Race/Ethnicity | Number |
|---|---|
| White | 283 |
| Black or African American | 115 |
| Hispanic | 72 |
| Asian | 12 |
| International | 12 |
| Multi-Ethnic | 11 |
| Unknown | 7 |
| Native Hawaiian or Pacific Islander | 2 |
See racial/ethnic breakdown for all students.
| Race/Ethnicity | Number |
|---|---|
| White | 5,374 |
| Hispanic | 2,070 |
| Black or African American | 1,209 |
| Multi-Ethnic | 327 |
| Asian | 194 |
| Unknown | 162 |
| International | 128 |
| Native Hawaiian or Pacific Islander | 36 |
There are approximately 5,645 female students and 3,901 male students at SEU.
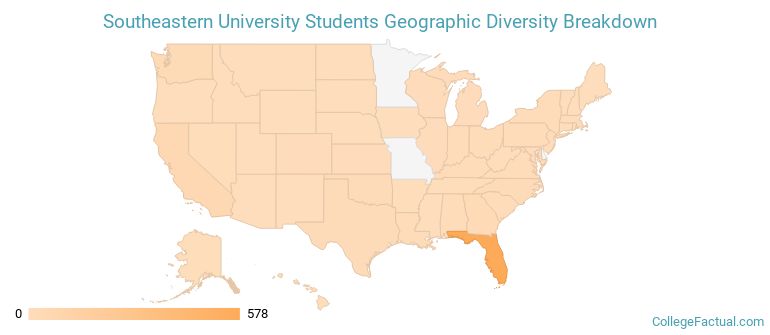
SEU ranks 240 out of 2,183 when it comes to geographic diversity.
41.5% of SEU students come from out of state, and 2% come from out of the country.
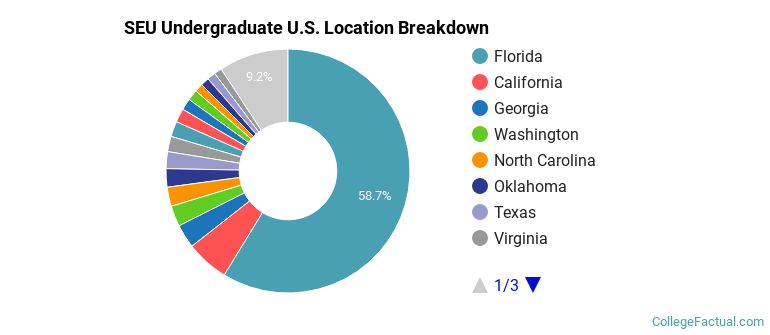
The undergraduate student body is split among 42 states (may include Washington D.C.). Click on the map for more detail.
| State | Amount |
|---|---|
| Florida | 578 |
| California | 56 |
| Georgia | 31 |
| Washington | 27 |
| North Carolina | 25 |
Students from 39 countries are represented at this school, with the majority of the international students coming from Brazil, Bahamas, and Colombia.
Learn more about international students at SEU.
A traditional college student is defined as being between the ages of 18-21. At SEU, 46.59% of students fall into that category, compared to the national average of 60%.
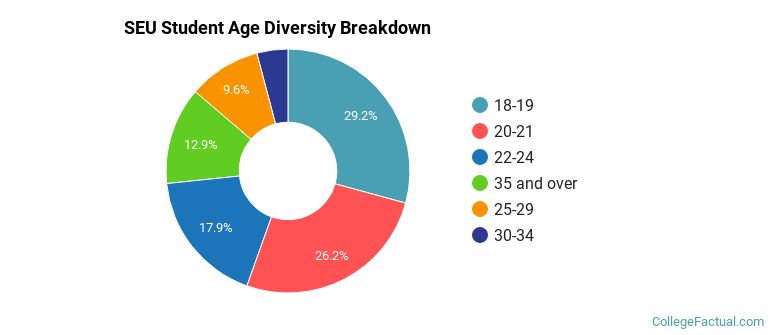
| Student Age Group | Amount |
|---|---|
| 18-19 | 1,759 |
| 20-21 | 1,578 |
| 22-24 | 1,076 |
| 35 and over | 776 |
| 25-29 | 579 |
| 30-34 | 248 |
| Under 18 | 0 |
Footnotes
*The racial-ethnic minorities count is calculated by taking the total number of students and subtracting white students, international students, and students whose race/ethnicity was unknown. This number is then divided by the total number of students at the school to obtain the racial-ethnic minorities percentage.
References
Department of Homeland Security Citizenship and Immigration Services
Image Credit: By FireKnight1935 under License
Learn more about how College Factual creates their Diversity Rankings.