Here, you'll find out more about the major, including such details as the number of graduates, what degree levels are offered, ethnicity of students, average salaries, and more. In addition, we cover how SCSU ranks in comparison to other schools with education programs.
Go directly to any of the following sections:
The bachelor's program at SCSU was ranked #125 on College Factual's Best Schools for education list.
During the 2021-2022 academic year, Southern Connecticut State University handed out 0 bachelor's degrees in general education.
In 2022, 23 students received their master’s degree in education from SCSU. This makes it the #156 most popular school for education master’s degree candidates in the country.
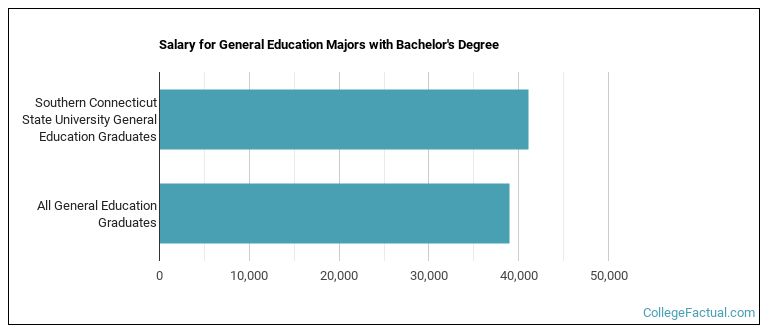
The median salary of education students who receive their bachelor's degree at SCSU is $41,129. This is higher than $38,982, which is the national median for all education bachelor's degree recipients.
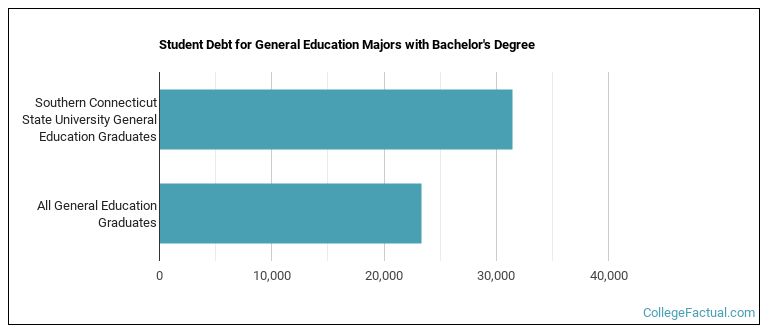
While getting their bachelor's degree at SCSU, education students borrow a median amount of $31,430 in student loans. This is higher than the the typical median of $23,353 for all education majors across the country.
The typical student loan payment of a bachelor's degree student from the education program at SCSU is $279 per month.
Part-time undergraduates at SCSU paid an average of $278 per credit hour in 2022-2023. This tuition was the same for both in-state and out-of-state students. Information about average full-time undergraduate tuition and fees is shown in the table below.
| In State | Out of State | |
|---|---|---|
| Tuition | $6,664 | $19,940 |
| Fees | $6,164 | $6,164 |
| Books and Supplies | $1,200 | $1,200 |
| On Campus Room and Board | $14,700 | $14,700 |
| On Campus Other Expenses | $4,116 | $4,116 |
Learn more about SCSU tuition and fees.
Online degrees for the SCSU education bachelor’s degree program are not available at this time. To see if the school offers distance learning options in other areas, visit the SCSU Online Learning page.
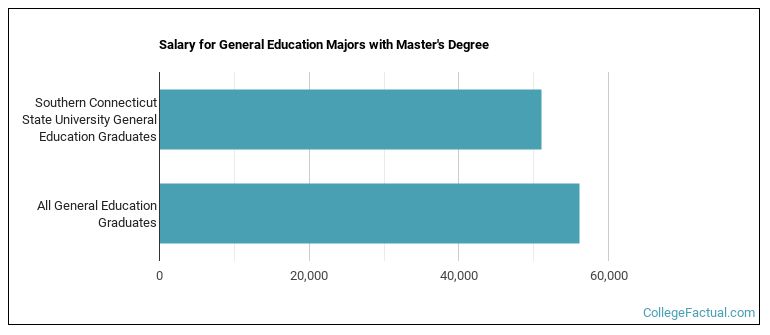
Graduates of the master's education program at SCSU make a median salary of $51,007. This is less than what their typical peers from other schools make. Their median salary is $56,157.
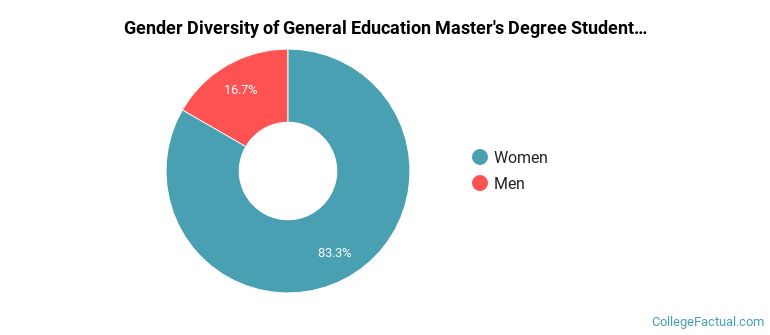
For the most recent academic year available, 17% of education master's degrees went to men and 83% went to women.
The majority of master's degree recipients in this major at SCSU are white. In the most recent graduating class for which data is available, 75% of students fell into this category.
The following table and chart show the ethnic background for students who recently graduated from Southern Connecticut State University with a master's in education.
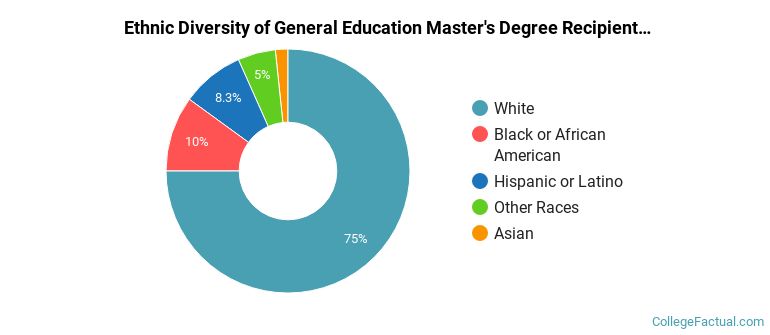
| Ethnic Background | Number of Students |
|---|---|
| Asian | 1 |
| Black or African American | 6 |
| Hispanic or Latino | 5 |
| White | 45 |
| Non-Resident Aliens | 0 |
| Other Races | 3 |
Take a look at the following statistics related to the make-up of the education majors at Southern Connecticut State University.
| Related Major | Annual Graduates |
|---|---|
| Special Education | 97 |
| Teacher Education Grade Specific | 87 |
| Educational Administration | 70 |
| Teacher Education Subject Specific | 69 |
| Multilingual Education | 18 |
More about our data sources and methodologies.