SIUE total enrollment is approximately 12,860 students. 8,071 are undergraduates and 1,295 are graduate students.
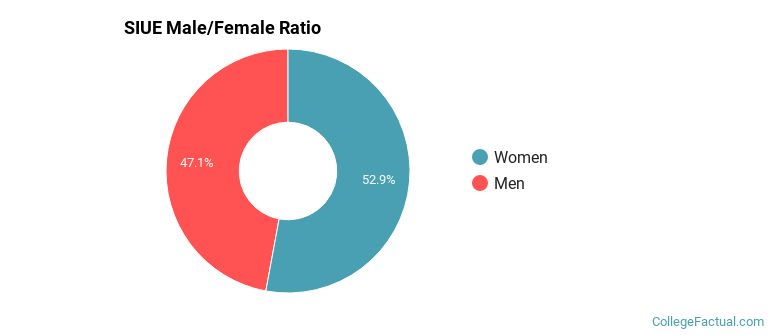
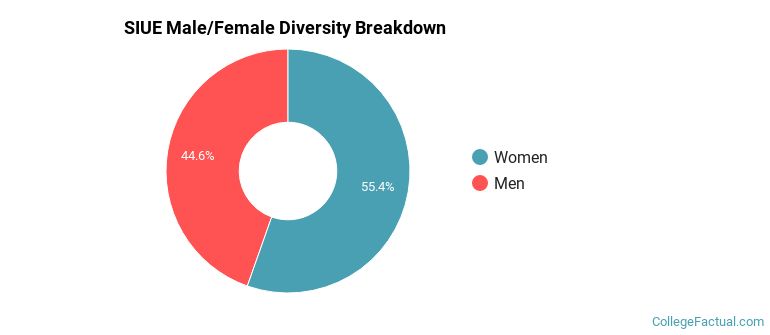
Male/Female Breakdown of Undergraduates
The full-time SIUE undergraduate population is made up of 55% women, and 45% men.
For the gender breakdown for all students, go here.
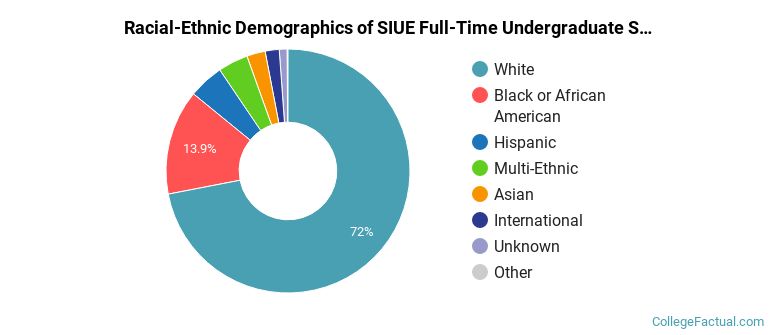
SIUE Racial/Ethnic Breakdown of Undergraduates
| Race/Ethnicity | Number |
|---|---|
| White | 5,825 |
| Black or African American | 1,042 |
| Hispanic | 403 |
| Multi-Ethnic | 337 |
| Asian | 211 |
| International | 141 |
| Unknown | 85 |
| Native Hawaiian or Pacific Islander | 11 |
See racial/ethnic breakdown for all students.
Male/Female Breakdown of Graduate Students
About 61% of full-time grad students are women, and 39% men.

For the gender breakdown for all students, go here.
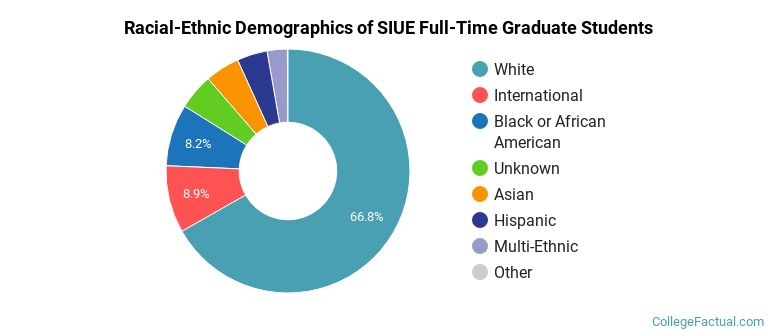
SIUE Racial-Ethnic Breakdown of Graduate Students
| Race/Ethnicity | Number |
|---|---|
| White | 892 |
| Black or African American | 121 |
| International | 105 |
| Asian | 58 |
| Hispanic | 52 |
| Unknown | 33 |
| Multi-Ethnic | 31 |
| Native Hawaiian or Pacific Islander | 1 |
See racial/ethnic breakdown for all students.
| Race/Ethnicity | Number |
|---|---|
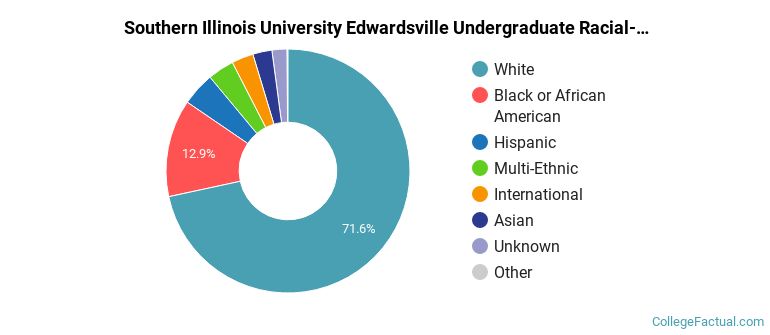
| White | 9,149 |
| Black or African American | 1,595 |
| Hispanic | 637 |
| Multi-Ethnic | 442 |
| International | 362 |
| Asian | 352 |
| Unknown | 280 |
| Native Hawaiian or Pacific Islander | 18 |
There are approximately 7,383 female students and 5,477 male students at SIUE.
SIUE ranks 1,292 out of 2,183 when it comes to geographic diversity.
15.04% of SIUE students come from out of state, and 0.36% come from out of the country.
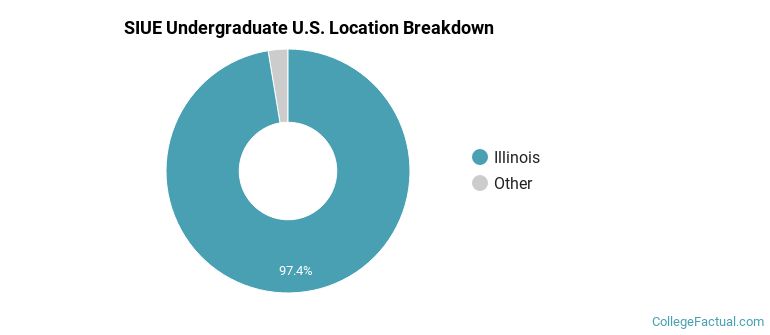
The undergraduate student body is split among 20 states (may include Washington D.C.). Click on the map for more detail.
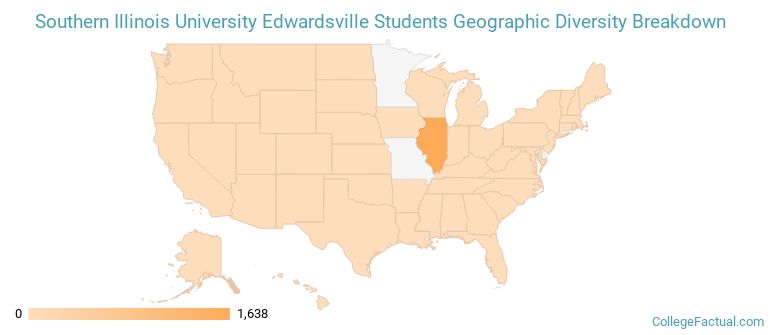
| State | Amount |
|---|---|
| Illinois | 1,638 |
| Tennessee | 7 |
| Wisconsin | 6 |
| Colorado | 5 |
| Indiana | 5 |
Students from 59 countries are represented at this school, with the majority of the international students coming from India, Turkey, and Nigeria.
Learn more about international students at SIUE.
A traditional college student is defined as being between the ages of 18-21. At SIUE, 53.70% of students fall into that category, compared to the national average of 60%.
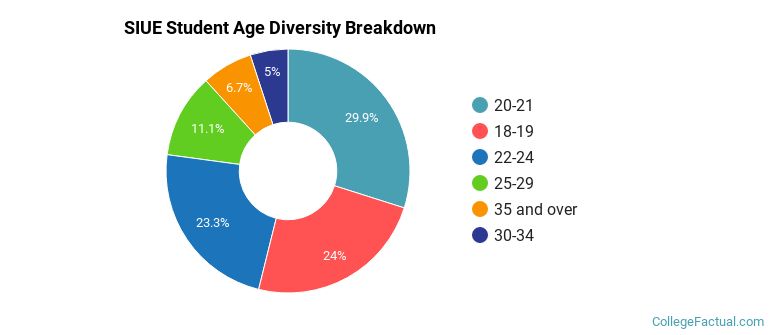
| Student Age Group | Amount |
|---|---|
| 20-21 | 4,111 |
| 18-19 | 3,298 |
| 22-24 | 3,200 |
| 25-29 | 1,529 |
| 35 and over | 926 |
| 30-34 | 689 |
| Under 18 | 0 |
Footnotes
*The racial-ethnic minorities count is calculated by taking the total number of students and subtracting white students, international students, and students whose race/ethnicity was unknown. This number is then divided by the total number of students at the school to obtain the racial-ethnic minorities percentage.
References
Department of Homeland Security Citizenship and Immigration Services
Image Credit: By Illinois2011 (Tyler Warren) under License
Learn more about how College Factual creates their Diversity Rankings.