Here is an overview of this program at SMU. Degrees are awarded at the Bachelor’s level, with graduate study also available. Its best result is a rank of #2 out of 24 schools (Bachelor’s level) by College Factual. Jump to any of the following sections:
College Factual ranks SMU highly for economics, placing at #59 out of 471 schools nationally.
| Ranking | Rank |
|---|---|
| Best Economics Schools | 59 of 471 |
| Best Economics Schools in Texas | 2 of 20 |
| Best Economics Schools in the Southwest Region | 2 of 27 |
The table below lists every degree level offered in economics at SMU, along with how many graduates complete each level annually.
| Degree Level | Annual Graduates |
|---|---|
| Bachelor’s | 180 |
| Master’s | 16 |
| Doctoral | 2 |
During the most recent reporting year, Southern Methodist University conferred 180 bachelor’s degrees in economics.
SMU is in the top 10% of the country for economics at the bachelor’s level. Its best result was #2 out of 24 schools by College Factual.
| Ranking | Rank |
|---|---|
| Best Economics Bachelor’s Degree Schools in the Southwest Region | 2 |
| Best Economics Bachelor’s Degree Schools in Texas | 2 |
| Best Economics Bachelor’s Degree Schools | 55 |
Economics graduates with a bachelor’s degree from SMU report a median salary of $74,491 a year. This is lower than $82,838, the median for all majors at SMU.
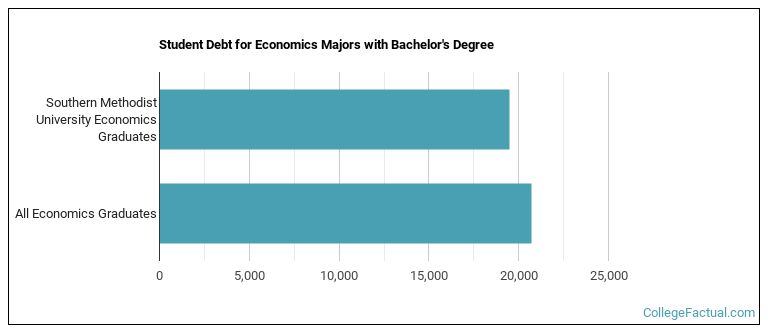
Earning a bachelor’s degree at SMU, economics students accumulate a median of $19,500 in student loans. This is lower than $20,712, the typical median for all majors at SMU.
Information about average full-time undergraduate tuition and fees is shown in the table below.
| In State | Out of State | |
|---|---|---|
| Tuition | $53,464 | $59,500 |
| Fees | $7,540 | $7,540 |
Find out more about SMU tuition and fees.
In the most recent graduating class, 71% of economics bachelor’s degrees went to men and 29% went to women.
 The majority of economics bachelor’s degree graduates at SMU are White. Roughly 59% of graduates fell into this category.
The following table and chart show the ethnic background for students who recently graduated from Southern Methodist University with a bachelor’s in economics.
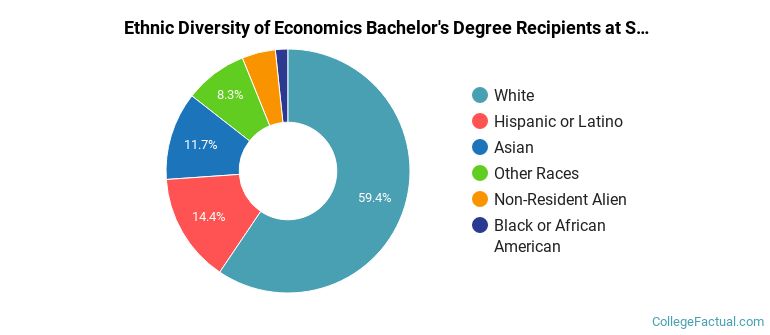
| Ethnic Background | Number of Students |
|---|---|
| Asian | 21 |
| Black or African American | 3 |
| Hispanic or Latino | 26 |
| White | 107 |
| Non-Resident Aliens | 8 |
| Other Races | 15 |
You can also pursue this field at the graduate level at SMU. The following graduate award levels are reported.
| Graduate Level | Annual Graduates |
|---|---|
| Master’s Degrees in Economics | 16 |
| Doctoral Degrees in Economics | 2 |
