SMU total enrollment is approximately 12,373 students. 6,616 are undergraduates and 2,688 are graduate students.
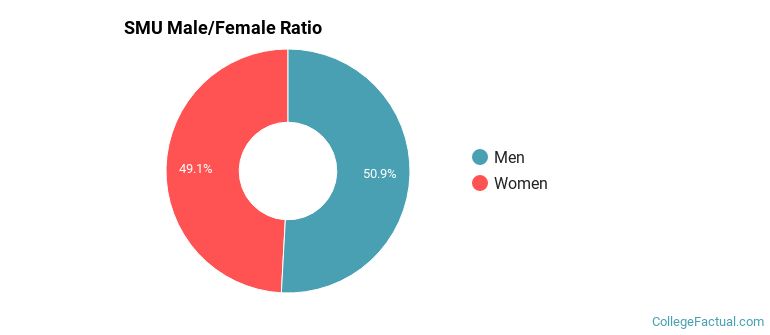
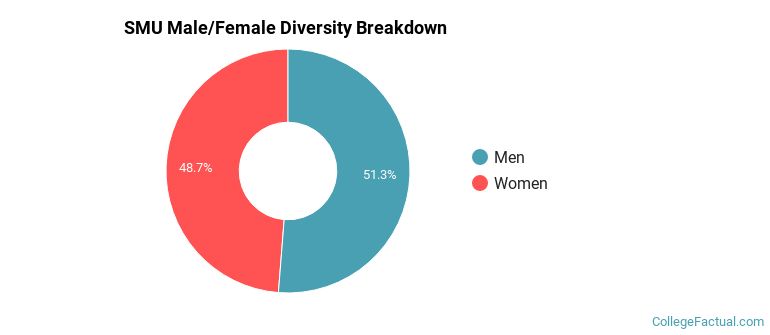
Male/Female Breakdown of Undergraduates
The full-time SMU undergraduate population is made up of 49% women, and 51% men.
For the gender breakdown for all students, go here.
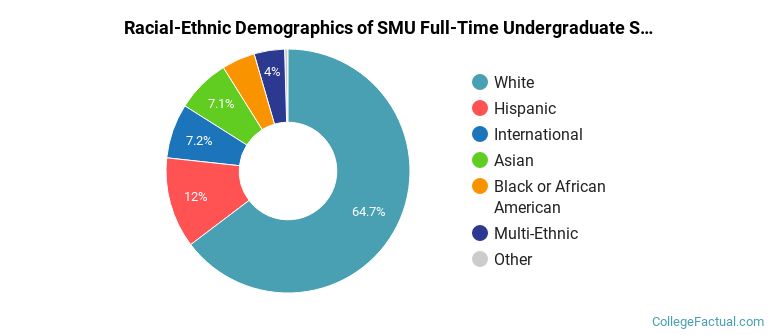
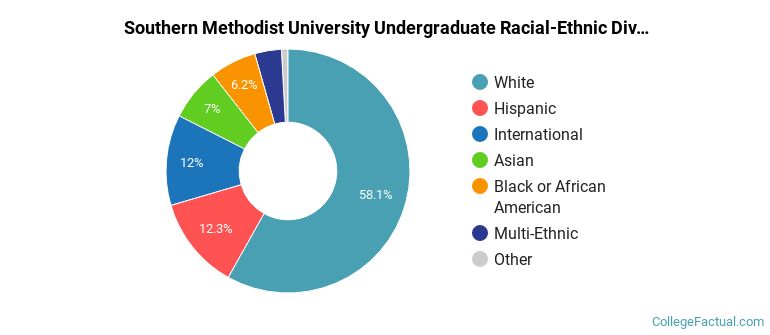
SMU Racial/Ethnic Breakdown of Undergraduates
| Race/Ethnicity | Number |
|---|---|
| White | 4,229 |
| Hispanic | 828 |
| Asian | 534 |
| International | 377 |
| Black or African American | 307 |
| Multi-Ethnic | 278 |
| Unknown | 47 |
| Native Hawaiian or Pacific Islander | 2 |
See racial/ethnic breakdown for all students.
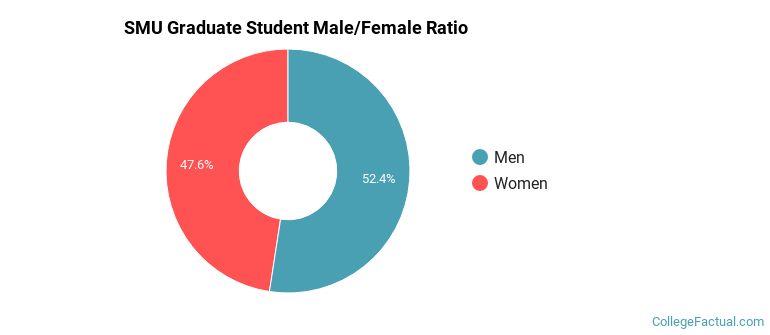
Male/Female Breakdown of Graduate Students
About 48% of full-time grad students are women, and 52% men.
For the gender breakdown for all students, go here.
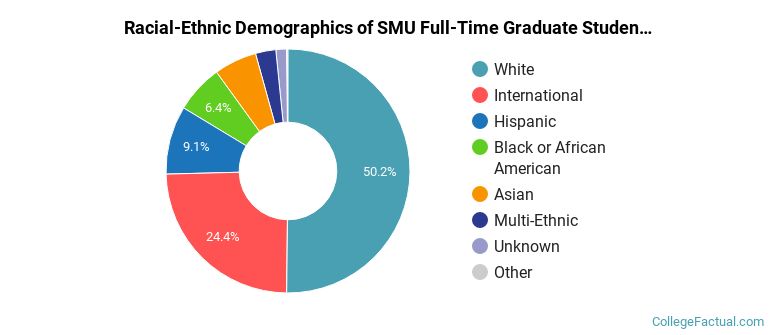
SMU Racial-Ethnic Breakdown of Graduate Students
| Race/Ethnicity | Number |
|---|---|
| White | 1,478 |
| International | 455 |
| Hispanic | 300 |
| Black or African American | 195 |
| Asian | 131 |
| Multi-Ethnic | 82 |
| Unknown | 41 |
| Native Hawaiian or Pacific Islander | 3 |
See racial/ethnic breakdown for all students.
| Race/Ethnicity | Number |
|---|---|
| White | 7,226 |
| Hispanic | 1,618 |
| International | 1,117 |
| Asian | 929 |
| Black or African American | 855 |
| Multi-Ethnic | 452 |
| Unknown | 143 |
| Native Hawaiian or Pacific Islander | 9 |
There are approximately 5,979 female students and 6,394 male students at SMU.
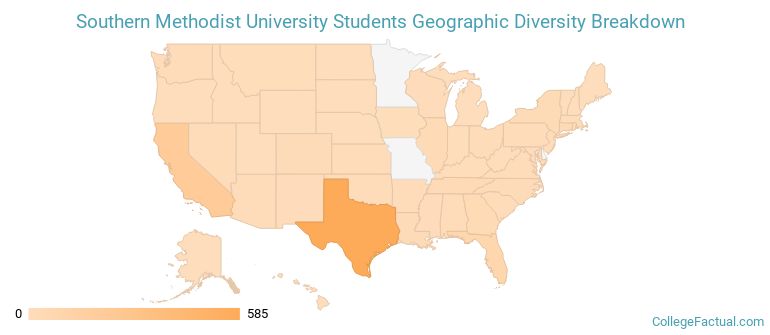
SMU ranks 162 out of 2,183 when it comes to geographic diversity.
58.49% of SMU students come from out of state, and 6.31% come from out of the country.
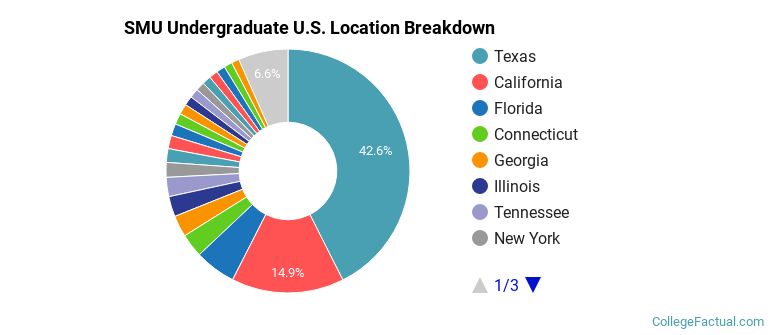
The undergraduate student body is split among 41 states (may include Washington D.C.). Click on the map for more detail.
| State | Amount |
|---|---|
| Texas | 585 |
| California | 205 |
| Florida | 75 |
| Connecticut | 43 |
| Georgia | 39 |
Students from 99 countries are represented at this school, with the majority of the international students coming from China, India, and Saudi Arabia.
Learn more about international students at SMU.
A traditional college student is defined as being between the ages of 18-21. At SMU, 47.88% of students fall into that category, compared to the national average of 60%.
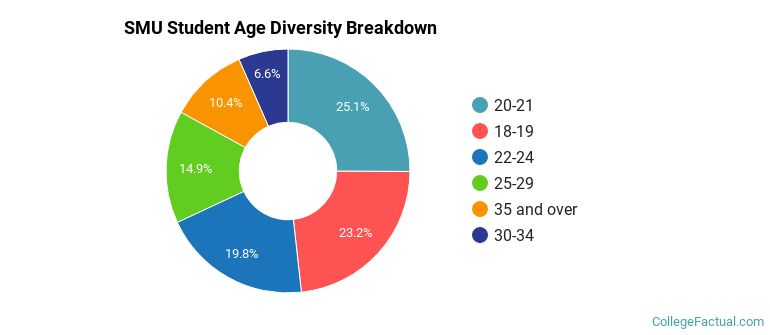
| Student Age Group | Amount |
|---|---|
| 20-21 | 2,932 |
| 18-19 | 2,712 |
| 22-24 | 2,320 |
| 25-29 | 1,744 |
| 35 and over | 1,220 |
| 30-34 | 771 |
| Under 18 | 0 |
Footnotes
*The racial-ethnic minorities count is calculated by taking the total number of students and subtracting white students, international students, and students whose race/ethnicity was unknown. This number is then divided by the total number of students at the school to obtain the racial-ethnic minorities percentage.
References
Department of Homeland Security Citizenship and Immigration Services
Image Credit: By Jeffrey Beall under License
Learn more about how College Factual creates their Diversity Rankings.