Here, you'll find out more about the major, including such details as the number of graduates, what degree levels are offered, ethnicity of students, average salaries, and more. We've also included details on how SNHU ranks compared to other colleges offering a major in cis.
Jump to any of the following sections:
The bachelor's program at SNHU was ranked #136 on College Factual's Best Schools for cis list. It is also ranked #3 in New Hampshire.
During the 2021-2022 academic year, Southern New Hampshire University handed out 482 bachelor's degrees in computer information systems. This is a decrease of 15% over the previous year when 564 degrees were handed out.
In 2022, 369 students received their master’s degree in cis from SNHU. This makes it the #10 most popular school for cis master’s degree candidates in the country.
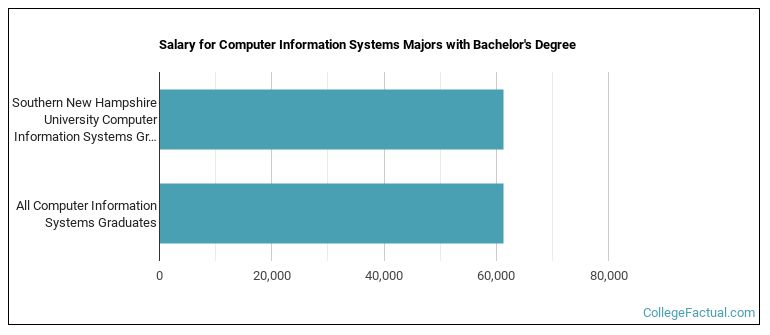
CIS majors who earn their bachelor's degree from SNHU go on to jobs where they make a median salary of $61,322 a year. This is higher than $61,300, which is the national median for all cis bachelor's degree recipients.
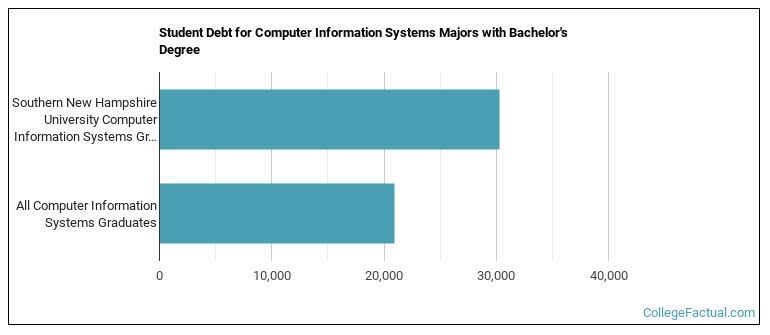
While getting their bachelor's degree at SNHU, cis students borrow a median amount of $30,298 in student loans. This is higher than the the typical median of $20,966 for all cis majors across the country.
During the 2022-2023 academic year, part-time undergraduate students at SNHU paid an average of $515 per credit hour. No discount was available for in-state students. Information about average full-time undergraduate tuition and fees is shown in the table below.
| In State | Out of State | |
|---|---|---|
| Tuition | $15,450 | $15,450 |
| Fees | $1,000 | $1,000 |
| Books and Supplies | $1,500 | $1,500 |
| On Campus Room and Board | $12,800 | $12,800 |
| On Campus Other Expenses | $9,700 | $9,700 |
Learn more about SNHU tuition and fees.
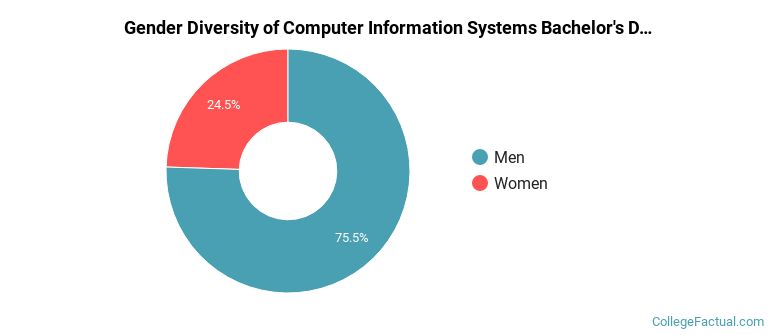
Of the 482 students who graduated with a Bachelor’s in cis from SNHU in 2022, 76% were men and 24% were women.
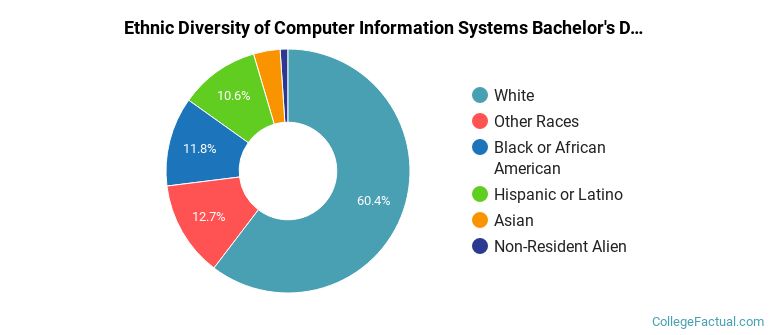
The majority of the students with this major are white. About 60% of 2022 graduates were in this category.
The following table and chart show the ethnic background for students who recently graduated from Southern New Hampshire University with a bachelor's in cis.
| Ethnic Background | Number of Students |
|---|---|
| Asian | 17 |
| Black or African American | 57 |
| Hispanic or Latino | 51 |
| White | 291 |
| Non-Resident Aliens | 5 |
| Other Races | 61 |
Online degrees for the SNHU cis bachelor’s degree program are not available at this time. To see if the school offers distance learning options in other areas, visit the SNHU Online Learning page.
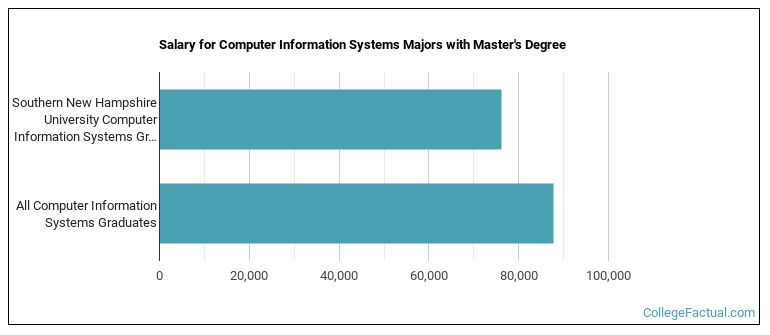
CIS majors graduating with a master's degree from SNHU make a median salary of $76,081 a year. This is less than what their typical peers from other schools make. Their median salary is $87,845.
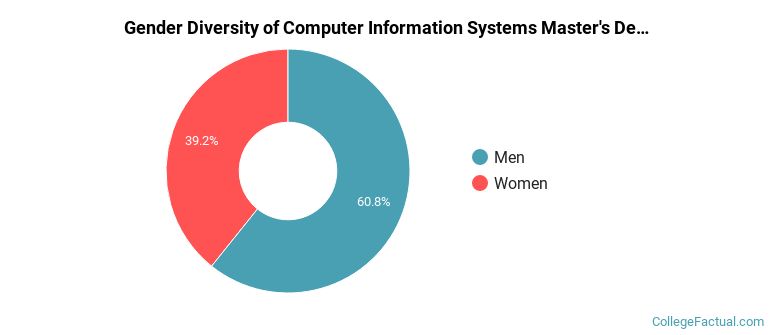
In the 2021-2022 academic year, 288 students earned a master's degree in cis from SNHU. About 39% of these graduates were women and the other 61% were men.
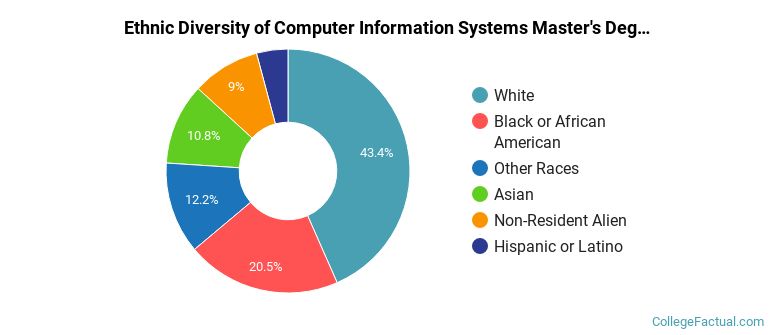
The following table and chart show the ethnic background for students who recently graduated from Southern New Hampshire University with a master's in cis.
| Ethnic Background | Number of Students |
|---|---|
| Asian | 31 |
| Black or African American | 59 |
| Hispanic or Latino | 12 |
| White | 125 |
| Non-Resident Aliens | 26 |
| Other Races | 35 |
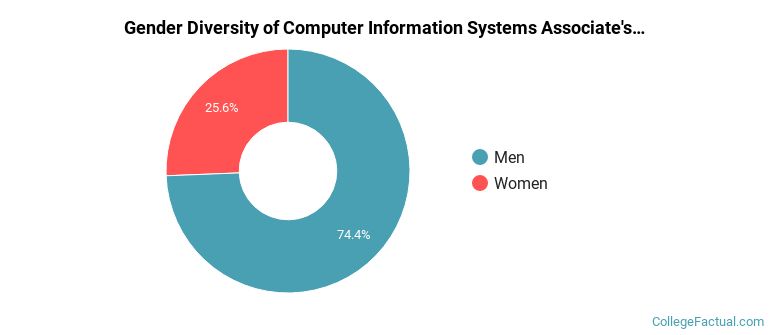
In the 2021-2022 academic year, 359 students earned a associate's degree in cis from SNHU. About 26% of these graduates were women and the other 74% were men.
The majority of the students with this major are white. About 54% of 2022 graduates were in this category.
The following table and chart show the ethnic background for students who recently graduated from Southern New Hampshire University with a associate's in cis.
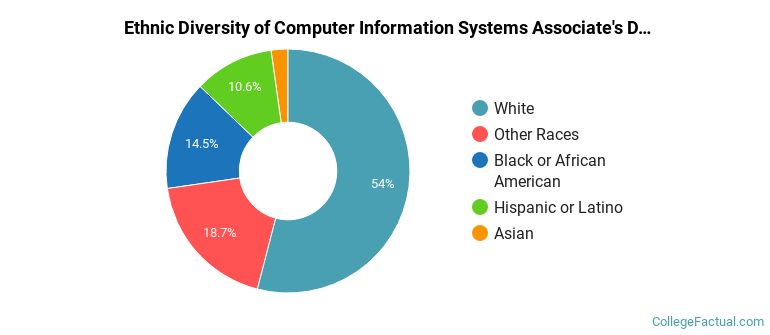
| Ethnic Background | Number of Students |
|---|---|
| Asian | 8 |
| Black or African American | 52 |
| Hispanic or Latino | 38 |
| White | 194 |
| Non-Resident Aliens | 0 |
| Other Races | 67 |
Take a look at the following statistics related to the make-up of the cis majors at Southern New Hampshire University.
| Related Major | Annual Graduates |
|---|---|
| Computer Science | 501 |
| Information Technology | 421 |
| Computer Software & Applications | 221 |
More about our data sources and methodologies.