Jump to any of the following sections:
The personal & culinary services major at SNHU is not ranked on College Factual’s Best Colleges and Universities for Personal & Culinary Services. This could be for a number of reasons, such as not having enough data on the major or school to make an accurate assessment of its quality.
During the 2021-2022 academic year, Southern New Hampshire University handed out 2 bachelor's degrees in personal & culinary services. This is an increase of 100% over the previous year when 1 degrees were handed out.
Part-time undergraduates at SNHU paid an average of $515 per credit hour in 2022-2023. This tuition was the same for both in-state and out-of-state students. Information about average full-time undergraduate tuition and fees is shown in the table below.
| In State | Out of State | |
|---|---|---|
| Tuition | $15,450 | $15,450 |
| Fees | $1,000 | $1,000 |
| Books and Supplies | $1,500 | $1,500 |
| On Campus Room and Board | $12,800 | $12,800 |
| On Campus Other Expenses | $9,700 | $9,700 |
Learn more about SNHU tuition and fees.
All of the 2 students who graduated with a Bachelor’s in personal & culinary services from SNHU in 2022 were men.
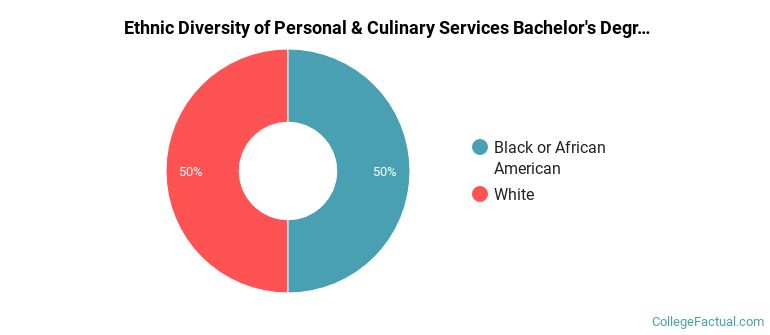
The following table and chart show the ethnic background for students who recently graduated from Southern New Hampshire University with a bachelor's in personal & culinary services.
| Ethnic Background | Number of Students |
|---|---|
| Asian | 0 |
| Black or African American | 1 |
| Hispanic or Latino | 0 |
| White | 1 |
| Non-Resident Aliens | 0 |
| Other Races | 0 |
Online degrees for the SNHU personal & culinary services bachelor’s degree program are not available at this time. To see if the school offers distance learning options in other areas, visit the SNHU Online Learning page.
Take a look at the following statistics related to the make-up of the personal & culinary services majors at Southern New Hampshire University.
Personal & Culinary Services students may decide to major in one of the following focus areas. Individual majors may not be available for all degree levels.
| Major | Annual Graduates |
|---|---|
| Culinary Arts | 2 |
| Related Major | Annual Graduates |
|---|---|
| Transportation & Materials Moving | 10 |
More about our data sources and methodologies.