SNHU total enrollment is approximately 134,345 students. 34,316 are undergraduates and 6,696 are graduate students.
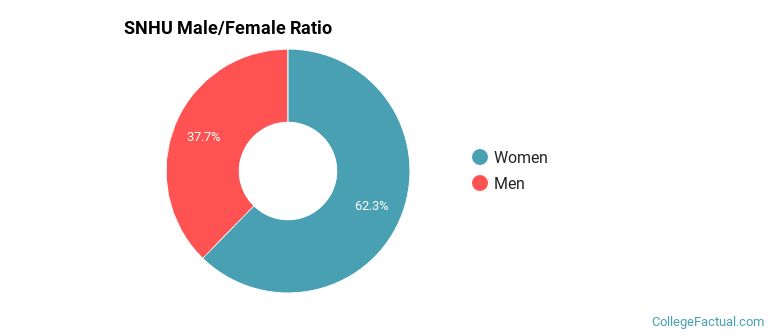
Male/Female Breakdown of Undergraduates
The full-time SNHU undergraduate population is made up of 62% women, and 38% men.
For the gender breakdown for all students, go here.
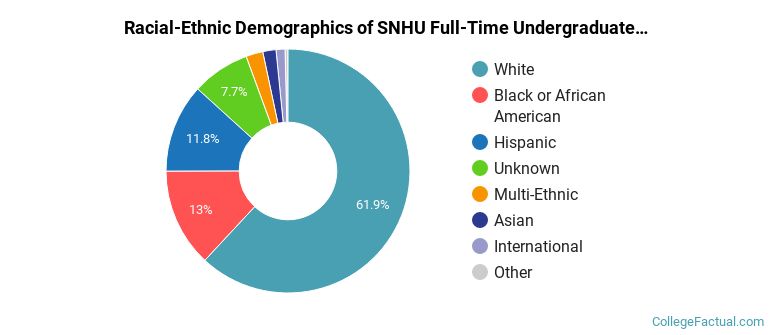
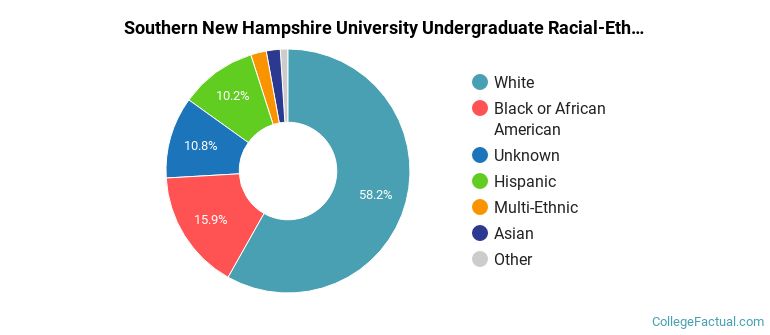
SNHU Racial/Ethnic Breakdown of Undergraduates
| Race/Ethnicity | Number |
|---|---|
| White | 19,010 |
| Unknown | 5,210 |
| Black or African American | 4,179 |
| Hispanic | 3,794 |
| Multi-Ethnic | 826 |
| Asian | 644 |
| International | 382 |
| Native Hawaiian or Pacific Islander | 115 |
See racial/ethnic breakdown for all students.
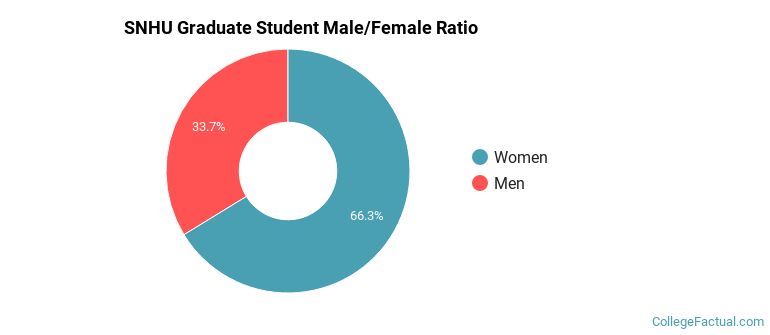
Male/Female Breakdown of Graduate Students
About 66% of full-time grad students are women, and 34% men.
For the gender breakdown for all students, go here.
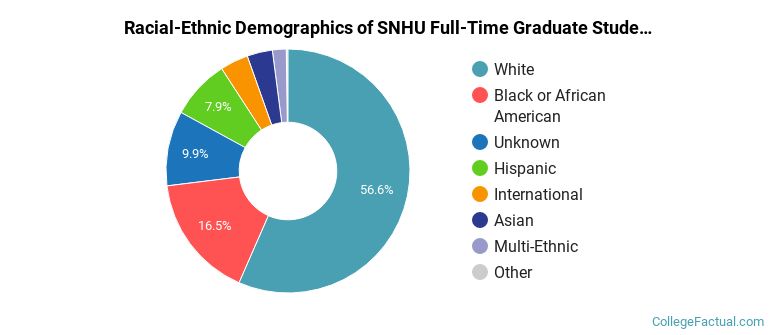
SNHU Racial-Ethnic Breakdown of Graduate Students
| Race/Ethnicity | Number |
|---|---|
| White | 3,496 |
| Black or African American | 1,012 |
| Unknown | 961 |
| Hispanic | 645 |
| Asian | 208 |
| International | 190 |
| Multi-Ethnic | 139 |
| Native Hawaiian or Pacific Islander | 18 |
See racial/ethnic breakdown for all students.
| Race/Ethnicity | Number |
|---|---|
| White | 71,494 |
| Unknown | 21,452 |
| Black or African American | 19,752 |
| Hispanic | 14,150 |
| Multi-Ethnic | 2,992 |
| Asian | 2,555 |
| International | 824 |
| Native Hawaiian or Pacific Islander | 443 |

There are approximately 86,267 female students and 48,078 male students at SNHU.
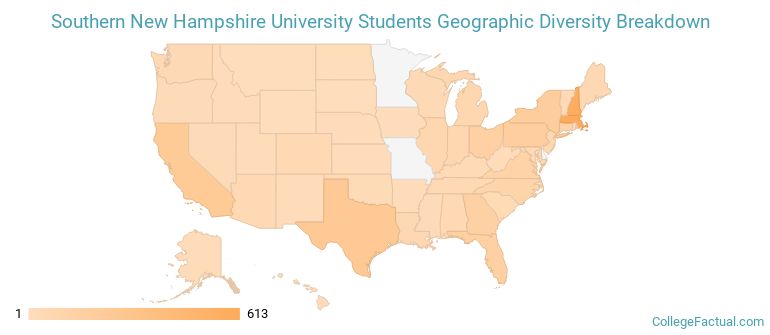
SNHU ranks 29 out of 2,183 when it comes to geographic diversity.
84.3% of SNHU students come from out of state, and 1.01% come from out of the country.
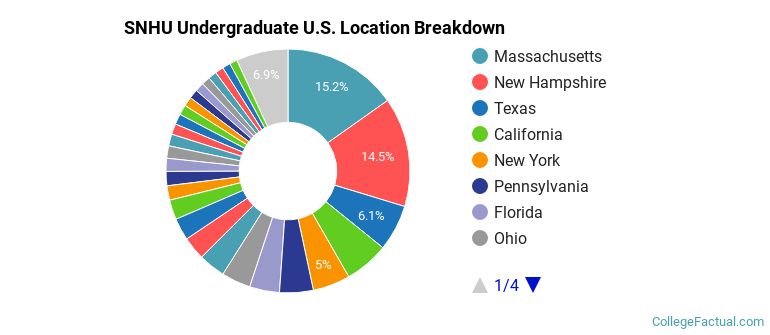
The undergraduate student body is split among 49 states (may include Washington D.C.). Click on the map for more detail.
| State | Amount |
|---|---|
| Massachusetts | 613 |
| New Hampshire | 585 |
| Texas | 247 |
| California | 237 |
| New York | 200 |
Students from 81 countries are represented at this school, with the majority of the international students coming from India, China, and Saudi Arabia.
Learn more about international students at SNHU.
A traditional college student is defined as being between the ages of 18-21. At SNHU, 8.31% of students fall into that category, compared to the national average of 60%.
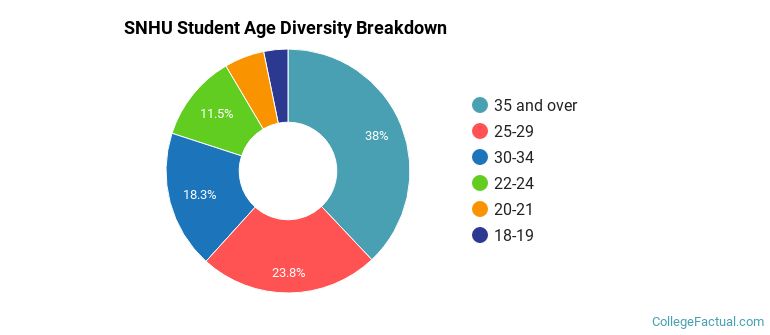
| Student Age Group | Amount |
|---|---|
| 35 and over | 33,732 |
| 25-29 | 21,138 |
| 30-34 | 16,242 |
| 22-24 | 10,211 |
| 20-21 | 4,709 |
| 18-19 | 2,853 |
| Under 18 | 0 |
Footnotes
*The racial-ethnic minorities count is calculated by taking the total number of students and subtracting white students, international students, and students whose race/ethnicity was unknown. This number is then divided by the total number of students at the school to obtain the racial-ethnic minorities percentage.
References
Department of Homeland Security Citizenship and Immigration Services
Image Credit: By Kylejtod at en.wikipedia under License
Find out how College Factual created their Diversity Rankings.