We've gathered data and other essential information about the program, such as the average salary of graduates, ethnicity of students, how many students graduated in recent times, and more. We've also included details on how SWU ranks compared to other colleges offering a major in human development.
Go directly to any of the following sections:
The bachelor's program at SWU was ranked #164 on College Factual's Best Schools for human development list. It is also ranked #5 in South Carolina.
| Ranking Type | Rank |
|---|---|
| Best Human Development & Family Studies Bachelor’s Degree Schools | 112 |
| Best Human Development & Family Studies Schools | 164 |
During the 2021-2022 academic year, Southern Wesleyan University handed out 16 bachelor's degrees in human development & family studies. This is a decrease of 33% over the previous year when 24 degrees were handed out.
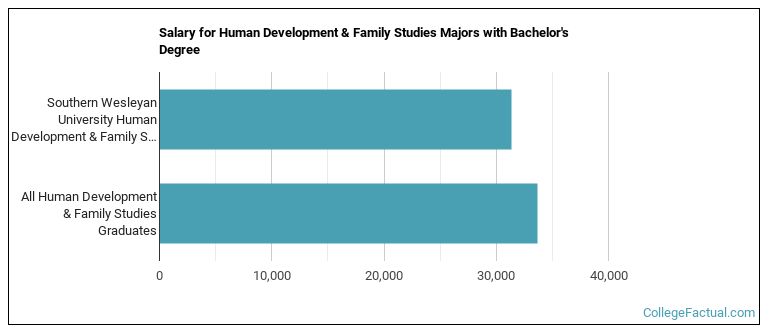
The median salary of human development students who receive their bachelor's degree at SWU is $31,326. This is less than $33,640, which is the national median of all human development majors in the nation who earn bachelor's degrees.
In 2022-2023, the average part-time undergraduate tuition at SWU was $1,060 per credit hour for both in-state and out-of-state students. The following table shows the average full-time tuition and fees for undergraduates.
| In State | Out of State | |
|---|---|---|
| Tuition | $26,520 | $26,520 |
| Fees | $1,350 | $1,350 |
| Books and Supplies | $1,060 | $1,060 |
| On Campus Room and Board | $10,654 | $10,654 |
| On Campus Other Expenses | $2,325 | $2,325 |
Learn more about SWU tuition and fees.
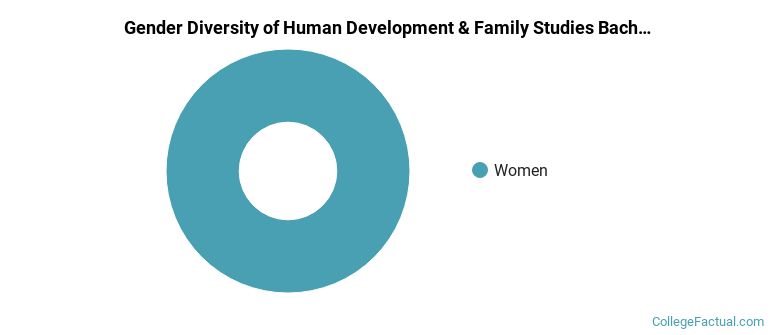
All of the 16 students who graduated with a Bachelor’s in human development from SWU in 2022 were women.
The following table and chart show the ethnic background for students who recently graduated from Southern Wesleyan University with a bachelor's in human development.
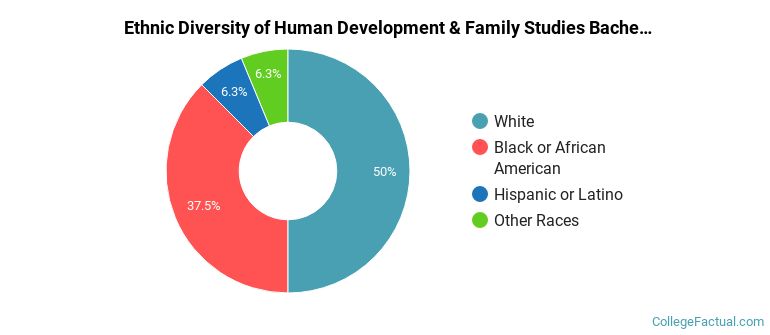
| Ethnic Background | Number of Students |
|---|---|
| Asian | 0 |
| Black or African American | 6 |
| Hispanic or Latino | 1 |
| White | 8 |
| Non-Resident Aliens | 0 |
| Other Races | 1 |
Online degrees for the SWU human development bachelor’s degree program are not available at this time. To see if the school offers distance learning options in other areas, visit the SWU Online Learning page.
Take a look at the following statistics related to the make-up of the human development majors at Southern Wesleyan University.
More about our data sources and methodologies.