We've gathered data and other essential information about the program, such as the ethnicity of students, how many students graduated in recent times, and more. Also, learn how Springfield College - School of Professional and Continuing Studies ranks among other schools offering degrees in mental health services.
Jump to any of the following sections:
Learn about start dates, transferring credits, availability of financial aid, and more by contacting the universities below.
BA in Psychology - Mental Health
Gain a strong foundation in the concepts involved with mental health therapy and assessment with this specialized online bachelor's from Southern New Hampshire University.
BA in Sociology - Community Health
Become a force for the public good by exploring current trends in health and health policy from a national and global perspective with this specialized online bachelor's from Southern New Hampshire University.
BS in Community Health Education
Focus on improving the health of individuals based on their lifestyle needs with this specialized online bachelor's from Southern New Hampshire University.
The mental health services major at Springfield College - School of Professional and Continuing Studies is not ranked on College Factual’s Best Colleges and Universities for Mental & Social Health Services. This could be for a number of reasons, such as not having enough data on the major or school to make an accurate assessment of its quality.
During the 2021-2022 academic year, Springfield College - School of Professional and Continuing Studies handed out 8 bachelor's degrees in mental & social health services. This is a decrease of 38% over the previous year when 13 degrees were handed out.
In 2022, 38 students received their master’s degree in mental health services from Springfield College - School of Professional and Continuing Studies. This makes it the #86 most popular school for mental health services master’s degree candidates in the country.
In 2022-2023, the average part-time undergraduate tuition at Springfield College - School of Professional and Continuing Studies was $532 per credit hour for both in-state and out-of-state students. The following table shows the average full-time tuition and fees for undergraduates.
| In State | Out of State | |
|---|---|---|
| Tuition | $19,152 | $19,152 |
Learn more about Springfield College - School of Professional and Continuing Studies tuition and fees.
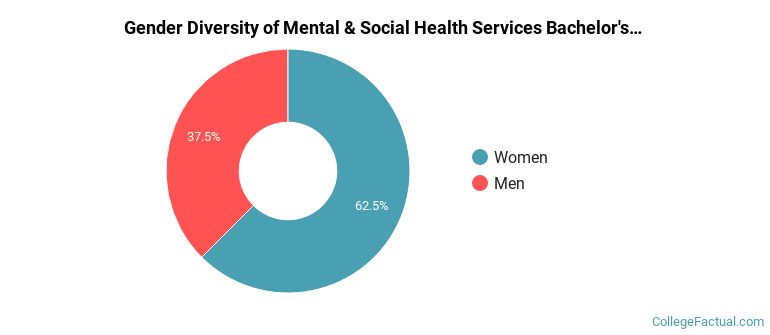
Of the 8 mental health services students who graduated with a bachelor's degree in 2021-2022 from Springfield College - School of Professional and Continuing Studies, about 38% were men and 63% were women.
The majority of the students with this major are white. About 75% of 2022 graduates were in this category.
The following table and chart show the ethnic background for students who recently graduated from Springfield College - School of Professional and Continuing Studies with a bachelor's in mental health services.
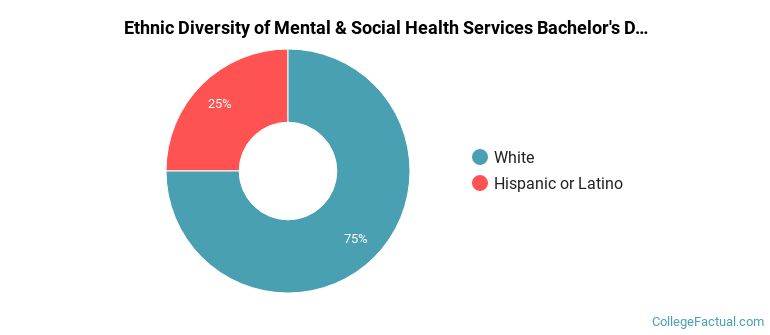
| Ethnic Background | Number of Students |
|---|---|
| Asian | 0 |
| Black or African American | 0 |
| Hispanic or Latino | 2 |
| White | 6 |
| Non-Resident Aliens | 0 |
| Other Races | 0 |
Springfield College - School of Professional and Continuing Studies does not offer an online option for its mental health services bachelor’s degree program at this time. To see if the school offers distance learning options in other areas, visit the Springfield College - School of Professional and Continuing Studies Online Learning page.
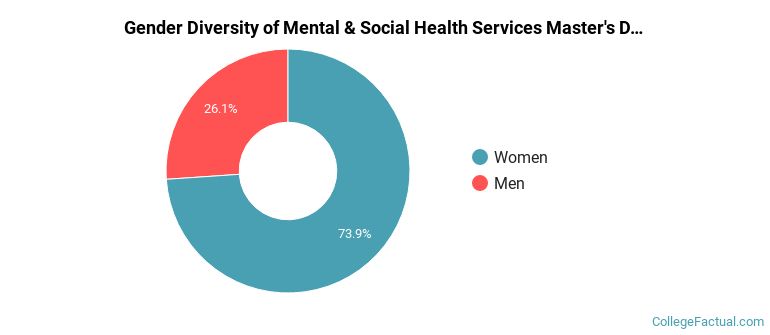
In the 2021-2022 academic year, 23 students earned a master's degree in mental health services from Springfield College - School of Professional and Continuing Studies. About 74% of these graduates were women and the other 26% were men.
The following table and chart show the ethnic background for students who recently graduated from Springfield College - School of Professional and Continuing Studies with a master's in mental health services.
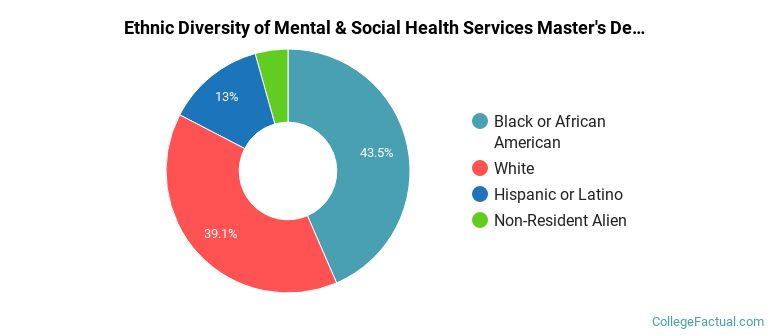
| Ethnic Background | Number of Students |
|---|---|
| Asian | 0 |
| Black or African American | 10 |
| Hispanic or Latino | 3 |
| White | 9 |
| Non-Resident Aliens | 1 |
| Other Races | 0 |
Take a look at the following statistics related to the make-up of the mental health services majors at Springfield College - School of Professional and Continuing Studies.
