St. Olaf total enrollment is approximately 2,953 students.
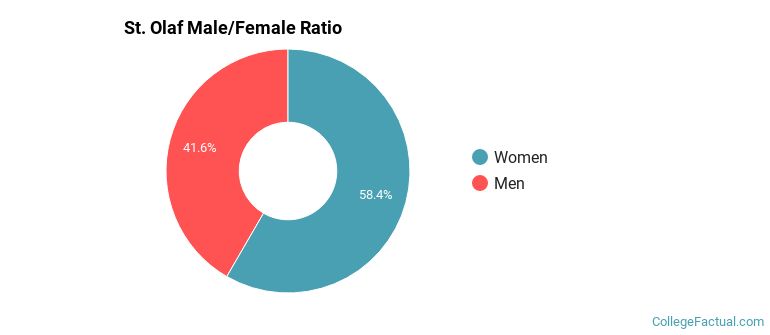
Male/Female Breakdown of Undergraduates
The full-time St. Olaf undergraduate population is made up of 59% women, and 41% men.
For the gender breakdown for all students, go here.
St. Olaf Racial/Ethnic Breakdown of Undergraduates
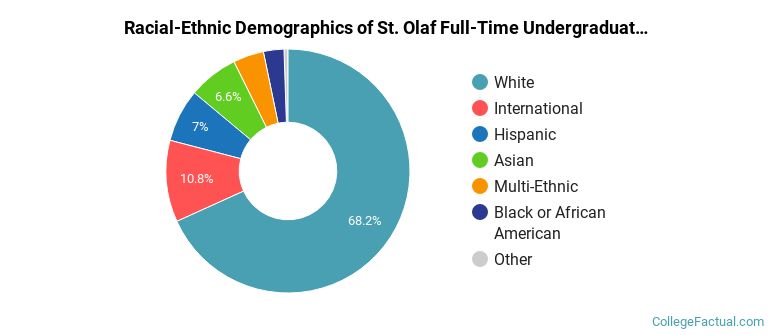
| Race/Ethnicity | Number |
|---|---|
| White | 1,967 |
| International | 289 |
| Hispanic | 220 |
| Asian | 199 |
| Multi-Ethnic | 124 |
| Black or African American | 95 |
| Unknown | 20 |
| Native Hawaiian or Pacific Islander | 1 |
See racial/ethnic breakdown for all students.
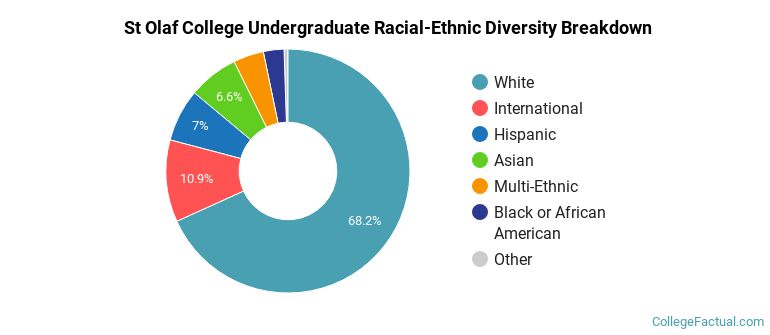
| Race/Ethnicity | Number |
|---|---|
| White | 1,997 |
| International | 291 |
| Hispanic | 223 |
| Asian | 199 |
| Multi-Ethnic | 125 |
| Black or African American | 96 |
| Unknown | 20 |
| Native Hawaiian or Pacific Islander | 1 |
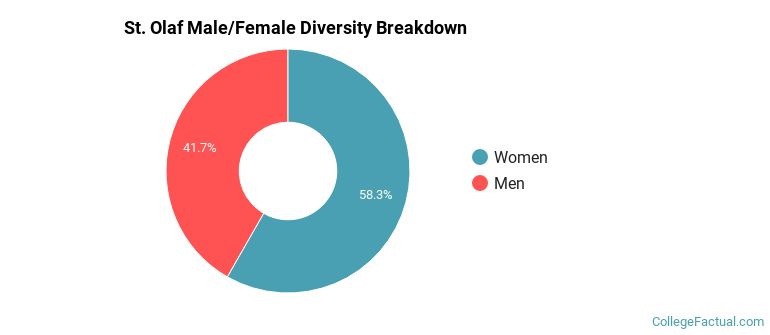
There are approximately 1,743 female students and 1,210 male students at St. Olaf.
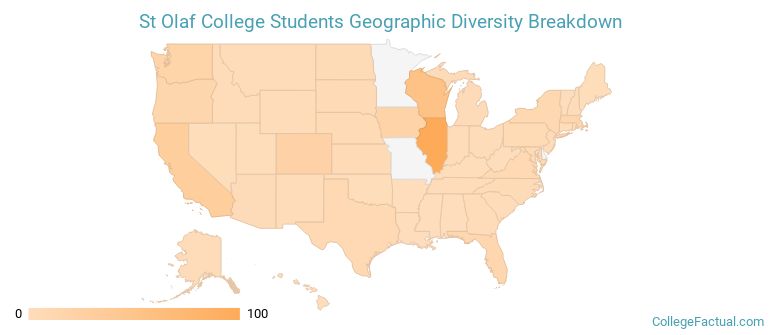
St. Olaf ranks 209 out of 2,183 when it comes to geographic diversity.
54.51% of St. Olaf students come from out of state, and 8.5% come from out of the country.
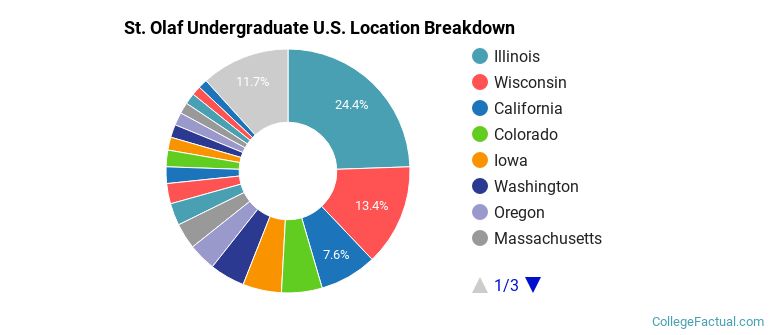
The undergraduate student body is split among 41 states (may include Washington D.C.). Click on the map for more detail.
| State | Amount |
|---|---|
| Illinois | 100 |
| Wisconsin | 55 |
| California | 31 |
| Colorado | 22 |
| Iowa | 21 |
Students from 94 countries are represented at this school, with the majority of the international students coming from China, Vietnam, and India.
Learn more about international students at St. Olaf.
A traditional college student is defined as being between the ages of 18-21. At St. Olaf, 90.94% of students fall into that category, compared to the national average of 60%.
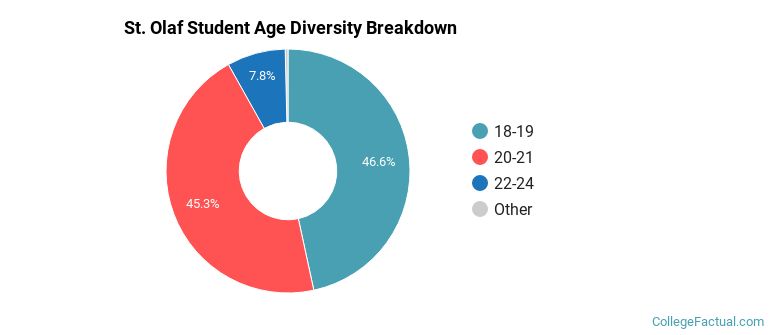
| Student Age Group | Amount |
|---|---|
| 18-19 | 1,400 |
| 20-21 | 1,360 |
| 22-24 | 233 |
| 25-29 | 7 |
| 35 and over | 3 |
| 30-34 | 1 |
| Under 18 | 0 |
Footnotes
*The racial-ethnic minorities count is calculated by taking the total number of students and subtracting white students, international students, and students whose race/ethnicity was unknown. This number is then divided by the total number of students at the school to obtain the racial-ethnic minorities percentage.
References
Department of Homeland Security Citizenship and Immigration Services
Image Credit: By Daniel Edwins a.k.a. Webmoof of English Wikipedia under License
Find out how College Factual created their Diversity Rankings.