We’ve pulled together the essential facts you should know about the program at SPC, Saint Petersburg College, St. Petersburg College. You can study it at the Bachelor’s, Associate’s, Certificate levels. At its best it places at #3 out of 3 schools (Bachelor’s level) by College Factual. Jump to any of the following sections:
By College Factual’s measure, SPC, Saint Petersburg College, St. Petersburg College among the top schools in the country for legal support services, placing at #65 out of 183 schools nationally.
| Ranking | Rank |
|---|---|
| Best Legal Support Services Schools | 65 of 183 |
| Best Legal Support Services Schools in Florida | 10 of 16 |
| Best Legal Support Services Schools in the Southeast Region | 14 of 43 |
The table below lists every degree level available for legal support services at SPC, Saint Petersburg College, St. Petersburg College, along with how many graduates complete each level annually.
| Degree Level | Annual Graduates |
|---|---|
| Bachelor’s | 40 |
| Associate’s | 8 |
| Certificate | 11 |
In the most recent year for which we have data, St Petersburg College awarded 40 bachelor’s degrees in legal support services.
SPC, Saint Petersburg College, St. Petersburg College holds a strong position among schools offering legal support services at the bachelor’s level. Specifically, it ranked #3 out of 3 schools by College Factual.
Legal Support Services graduates with a bachelor’s degree from SPC, Saint Petersburg College, St. Petersburg College earn a median of $42,067 a year. This is below $45,756, the median for all majors at SPC, Saint Petersburg College, St. Petersburg College.
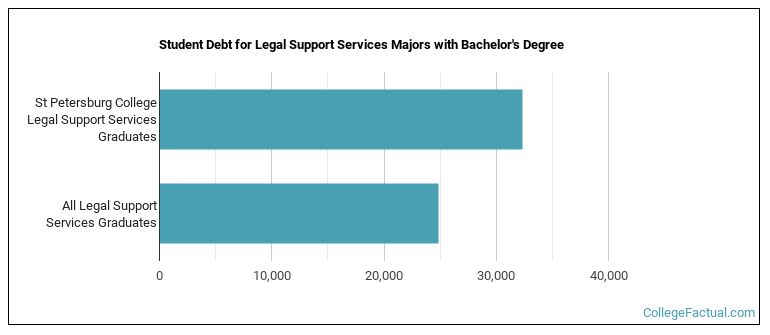
While getting their bachelor’s degree at SPC, Saint Petersburg College, St. Petersburg College, legal support services graduates take on a median debt of $32,383 in student loans. This is above $24,872, the typical median for all majors at SPC, Saint Petersburg College, St. Petersburg College.
The full-time undergraduate tuition and fees are shown below.
| In State | Out of State | |
|---|---|---|
| Tuition | $1,943 | $7,774 |
| Fees | $739 | $1,512 |
Read more about SPC, Saint Petersburg College, St. Petersburg College tuition and fees.
In the most recent graduating class, 28% of legal support services bachelor’s degrees went to men and 72% went to women.
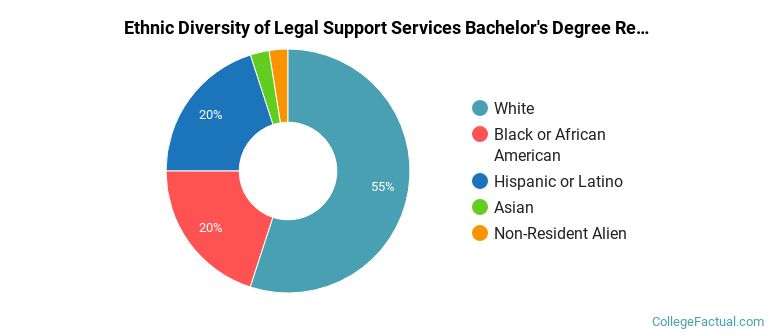
 The majority of legal support services bachelor’s degree graduates at SPC, Saint Petersburg College, St. Petersburg College were White. Roughly 55% of graduates fell into this category.
The following table and chart show the ethnic background for students who recently graduated from St Petersburg College with a bachelor’s in legal support services.
| Ethnic Background | Number of Students |
|---|---|
| Asian | 1 |
| Black or African American | 8 |
| Hispanic or Latino | 8 |
| White | 22 |
| Non-Resident Aliens | 1 |
| Other Races | 0 |
SPC, Saint Petersburg College, St. Petersburg College granted 40 bachelor’s degrees in legal assistant/paralegal in the latest year of data — 72% to women and 28% to men. The most common background among these graduates was White (55%).
For the most recent IPEDS reporting year, St Petersburg College handed out 8 associate’s degrees in legal support services.
SPC, Saint Petersburg College, St. Petersburg College is not yet ranked for legal support services at the associate’s level.
Among recent graduates, 12% of legal support services associate’s degrees went to men and 88% went to women.
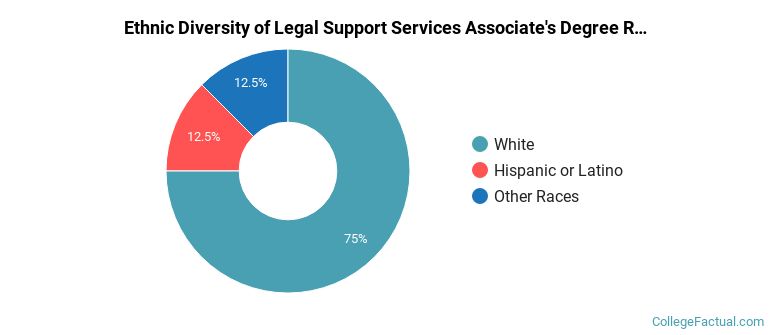
 The largest share of legal support services associate’s degree graduates at SPC, Saint Petersburg College, St. Petersburg College are White. Approximately 75% of graduates fell into this category.
The following table and chart show the ethnic background for students who recently graduated from St Petersburg College with a associate’s in legal support services.
| Ethnic Background | Number of Students |
|---|---|
| Asian | 0 |
| Black or African American | 0 |
| Hispanic or Latino | 1 |
| White | 6 |
| Non-Resident Aliens | 0 |
| Other Races | 1 |
SPC, Saint Petersburg College, St. Petersburg College conferred 8 associate’s degrees in legal assistant/paralegal recently — 88% to women and 12% to men. The largest share of these graduates were White (75%).
In the most recent year for which we have data, St Petersburg College conferred 11 certificate degrees in legal support services.
SPC, Saint Petersburg College, St. Petersburg College has not been ranked for legal support services at the certificate level.
For the most recent academic year available, 18% of legal support services certificate degrees went to men and 82% went to women.
 The majority of legal support services certificate degree graduates at SPC, Saint Petersburg College, St. Petersburg College are Hispanic or Latino. Roughly 36% of graduates fell into this category.
The following table and chart show the ethnic background for students who recently graduated from St Petersburg College with a certificate in legal support services.

| Ethnic Background | Number of Students |
|---|---|
| Asian | 0 |
| Black or African American | 2 |
| Hispanic or Latino | 4 |
| White | 4 |
| Non-Resident Aliens | 0 |
| Other Races | 1 |
SPC, Saint Petersburg College, St. Petersburg College granted 11 certificate completions in legal assistant/paralegal in the latest year of data — 82% to women and 18% to men. The most common background among these graduates was Hispanic or Latino (36%).
