Stanford total enrollment is approximately 15,953 students. 5,752 are undergraduates and 8,465 are graduate students.
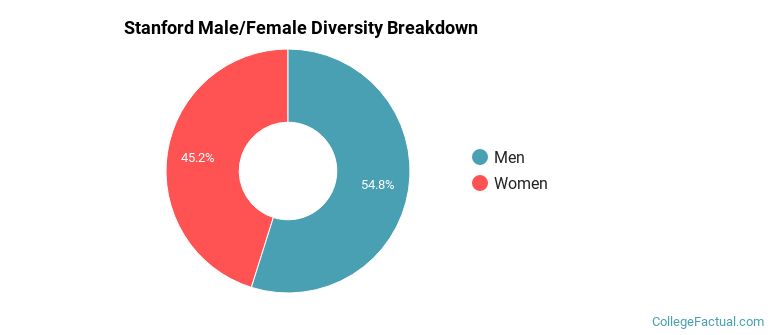
Male/Female Breakdown of Undergraduates
The full-time Stanford undergraduate population is made up of 51% women, and 49% men.

For the gender breakdown for all students, go here.
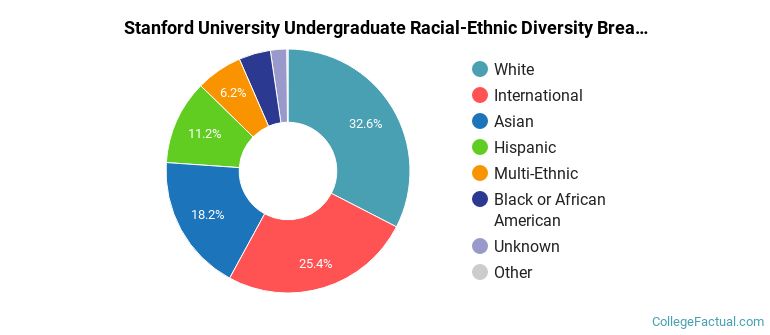
Stanford Racial/Ethnic Breakdown of Undergraduates

| Race/Ethnicity | Number |
|---|---|
| White | 1,616 |
| Asian | 1,403 |
| Hispanic | 992 |
| International | 649 |
| Multi-Ethnic | 545 |
| Black or African American | 456 |
| Native Hawaiian or Pacific Islander | 19 |
| Unknown | 13 |
See racial/ethnic breakdown for all students.
Male/Female Breakdown of Graduate Students
About 44% of full-time grad students are women, and 56% men.

For the gender breakdown for all students, go here.
Stanford Racial-Ethnic Breakdown of Graduate Students

| Race/Ethnicity | Number |
|---|---|
| White | 2,895 |
| International | 2,653 |
| Asian | 1,380 |
| Hispanic | 730 |
| Multi-Ethnic | 379 |
| Black or African American | 303 |
| Unknown | 108 |
| Native Hawaiian or Pacific Islander | 4 |
See racial/ethnic breakdown for all students.
| Race/Ethnicity | Number |
|---|---|
| White | 4,947 |
| International | 3,809 |
| Asian | 3,123 |
| Hispanic | 1,858 |
| Multi-Ethnic | 1,008 |
| Black or African American | 788 |
| Unknown | 317 |
| Native Hawaiian or Pacific Islander | 28 |
There are approximately 7,305 female students and 8,648 male students at Stanford.
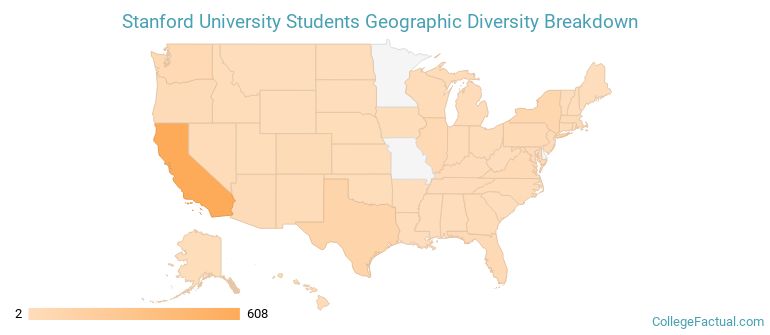
Stanford ranks 71 out of 2,183 when it comes to geographic diversity.
60.08% of Stanford students come from out of state, and 12.26% come from out of the country.
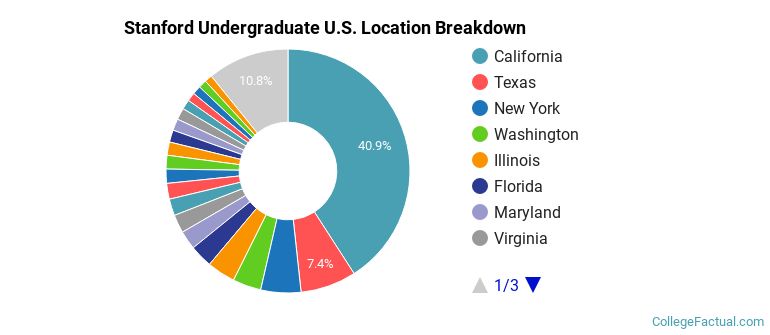
The undergraduate student body is split among 49 states (may include Washington D.C.). Click on the map for more detail.
| State | Amount |
|---|---|
| California | 608 |
| Texas | 110 |
| New York | 79 |
| Illinois | 56 |
| Washington | 56 |
Students from 127 countries are represented at this school, with the majority of the international students coming from China, India, and Canada.
Learn more about international students at Stanford.
A traditional college student is defined as being between the ages of 18-21. At Stanford, 32.45% of students fall into that category, compared to the national average of 60%.
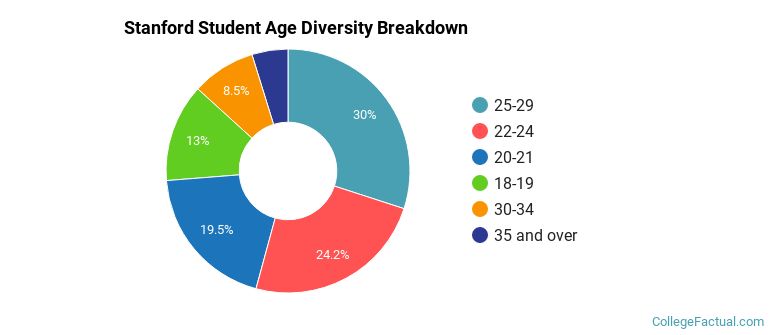
| Student Age Group | Amount |
|---|---|
| 25-29 | 5,246 |
| 22-24 | 4,237 |
| 20-21 | 3,414 |
| 18-19 | 2,275 |
| 30-34 | 1,481 |
| 35 and over | 836 |
| Under 18 | 0 |
Footnotes
*The racial-ethnic minorities count is calculated by taking the total number of students and subtracting white students, international students, and students whose race/ethnicity was unknown. This number is then divided by the total number of students at the school to obtain the racial-ethnic minorities percentage.
References
Department of Homeland Security Citizenship and Immigration Services
Find out how College Factual created their Diversity Rankings.