Here, you'll find out more about the major, including such details as the number of graduates, what degree levels are offered, ethnicity of students, average salaries, and more. In addition, we cover how SUNY New Paltz ranks in comparison to other schools with subject specific ed programs.
Jump to any of the following sections:
SUNY New Paltz is in the top 10% of the country for subject specific ed. More specifically it was ranked #43 out of 450 schools by College Factual. It is also ranked #11 in New York.
During the 2021-2022 academic year, SUNY New Paltz handed out 102 bachelor's degrees in teacher education subject specific. This is an increase of 1% over the previous year when 101 degrees were handed out.
In 2022, 85 students received their master’s degree in subject specific ed from SUNY New Paltz. This makes it the #36 most popular school for subject specific ed master’s degree candidates in the country.
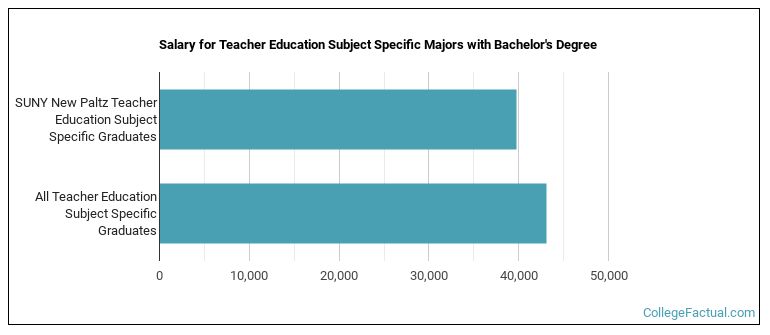
The median salary of subject specific ed students who receive their bachelor's degree at SUNY New Paltz is $39,714. This is less than $43,086, which is the national median of all subject specific ed majors in the nation who earn bachelor's degrees.
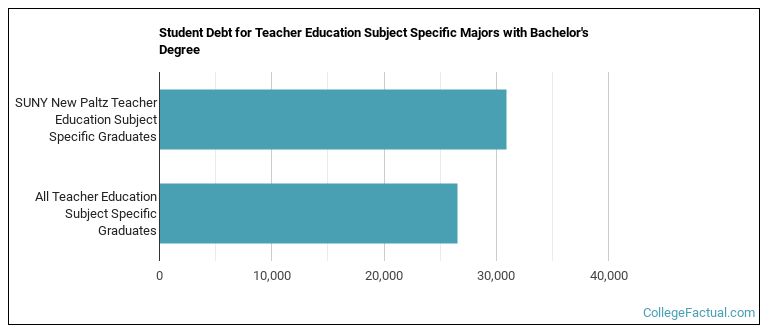
While getting their bachelor's degree at SUNY New Paltz, subject specific ed students borrow a median amount of $30,902 in student loans. This is higher than the the typical median of $26,530 for all subject specific ed majors across the country.
The typical student loan payment of a bachelor's degree student from the subject specific ed program at SUNY New Paltz is $318 per month.
Out-of-state part-time undergraduates at SUNY New Paltz paid an average of $708 per credit hour in 2022-2023. The average for in-state students was $295 per credit hour. The following table shows the average full-time tuition and fees for undergraduates.
| In State | Out of State | |
|---|---|---|
| Tuition | $7,070 | $16,980 |
| Fees | $1,454 | $1,454 |
| Books and Supplies | $1,240 | $1,240 |
| On Campus Room and Board | $15,896 | $15,896 |
| On Campus Other Expenses | $3,700 | $3,700 |
Learn more about SUNY New Paltz tuition and fees.
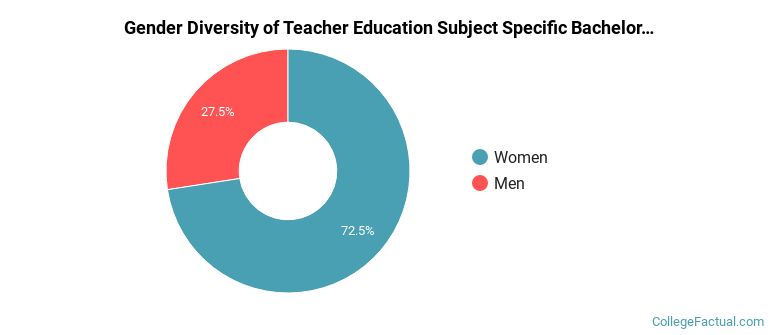
Of the 102 subject specific ed students who graduated with a bachelor's degree in 2021-2022 from SUNY New Paltz, about 27% were men and 73% were women.
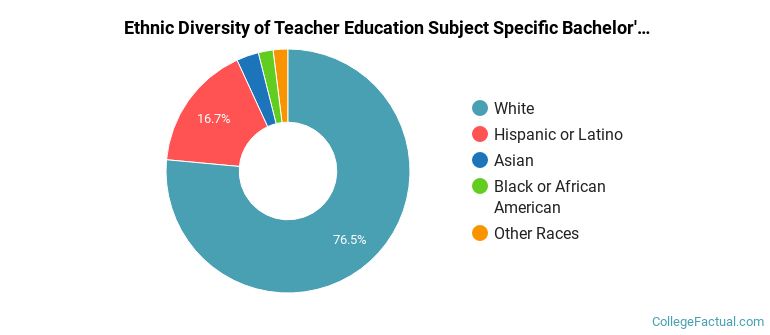
The majority of the students with this major are white. About 76% of 2022 graduates were in this category.
The following table and chart show the ethnic background for students who recently graduated from SUNY New Paltz with a bachelor's in subject specific ed.
| Ethnic Background | Number of Students |
|---|---|
| Asian | 3 |
| Black or African American | 2 |
| Hispanic or Latino | 17 |
| White | 78 |
| Non-Resident Aliens | 0 |
| Other Races | 2 |
Online degrees for the SUNY New Paltz subject specific ed bachelor’s degree program are not available at this time. To see if the school offers distance learning options in other areas, visit the SUNY New Paltz Online Learning page.
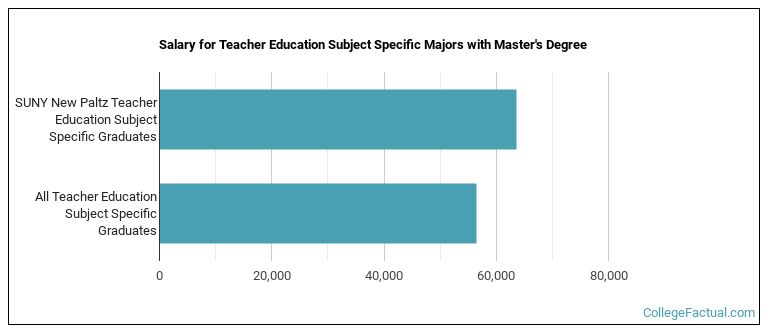
Graduates of the master's subject specific ed program at SUNY New Paltz make a median salary of $63,621. This is a better than average outcome since the median salary for all subject specific ed graduates with a master's is $56,457.
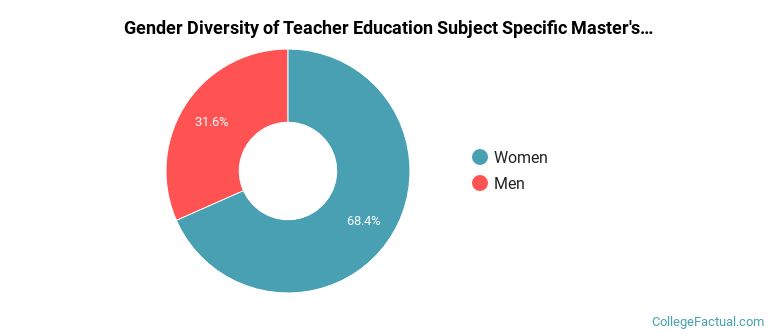
Of the 98 students who graduated with a Master’s in subject specific ed from SUNY New Paltz in 2022, 32% were men and 68% were women.
The majority of master's degree recipients in this major at SUNY New Paltz are white. In the most recent graduating class for which data is available, 73% of students fell into this category.
The following table and chart show the ethnic background for students who recently graduated from SUNY New Paltz with a master's in subject specific ed.
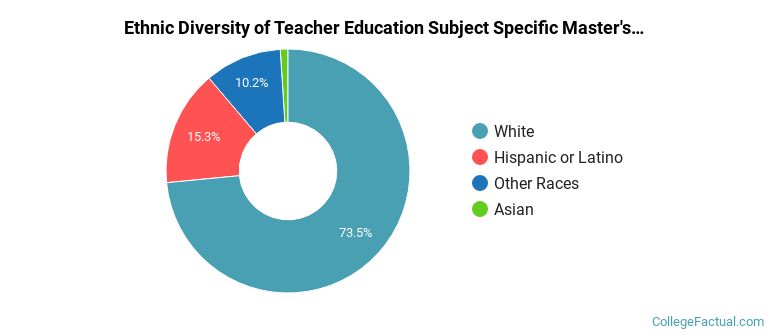
| Ethnic Background | Number of Students |
|---|---|
| Asian | 1 |
| Black or African American | 0 |
| Hispanic or Latino | 15 |
| White | 72 |
| Non-Resident Aliens | 0 |
| Other Races | 10 |
Take a look at the following statistics related to the make-up of the subject specific ed majors at SUNY New Paltz.
| Related Major | Annual Graduates |
|---|---|
| Teacher Education Grade Specific | 165 |
| Educational Administration | 50 |
| Teaching English or French | 21 |
| Multilingual Education | 11 |
| Special Education | 11 |
View All Teacher Education Subject Specific Related Majors >
More about our data sources and methodologies.