Here, you'll find out more about the major, including such details as the number of graduates, what degree levels are offered, ethnicity of students, average salaries, and more. We've also included details on how Stevens ranks compared to other colleges offering a major in me.
Go directly to any of the following sections:
Stevens is in the top 10% of the country for me. More specifically it was ranked #32 out of 321 schools by College Factual. It is also ranked #1 in New Jersey.
During the 2021-2022 academic year, Stevens Institute of Technology handed out 159 bachelor's degrees in mechanical engineering. This is an increase of 28% over the previous year when 124 degrees were handed out.
In 2022, 102 students received their master’s degree in me from Stevens. This makes it the #18 most popular school for me master’s degree candidates in the country.
In addition, 11 students received their doctoral degrees in me in 2022, making the school the #49 most popular school in the United States for this category of students.
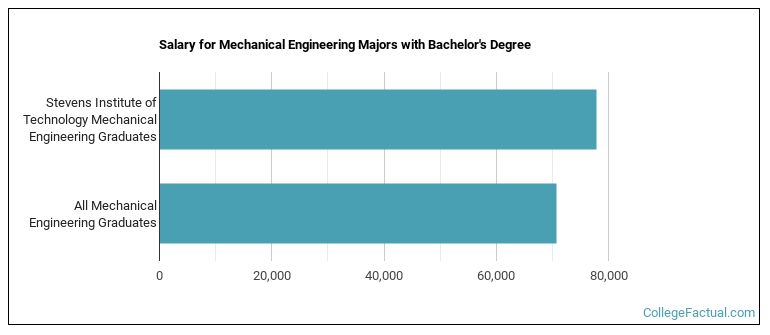
The median salary of me students who receive their bachelor's degree at Stevens is $77,925. This is great news for graduates of the program, since this figure is higher than the national average of $70,726 for all me bachelor's degree recipients.
The typical student loan payment of a bachelor's degree student from the me program at Stevens is $773 per month.
In 2022-2023, the average part-time undergraduate tuition at Stevens was $1,956 per credit hour for both in-state and out-of-state students. The average full-time tuition and fees for undergraduates are shown in the table below.
| In State | Out of State | |
|---|---|---|
| Tuition | $58,680 | $58,680 |
| Fees | $2,272 | $2,272 |
| Books and Supplies | $1,200 | $1,200 |
| On Campus Room and Board | $18,650 | $18,650 |
| On Campus Other Expenses | $1,050 | $1,050 |
Learn more about Stevens tuition and fees.
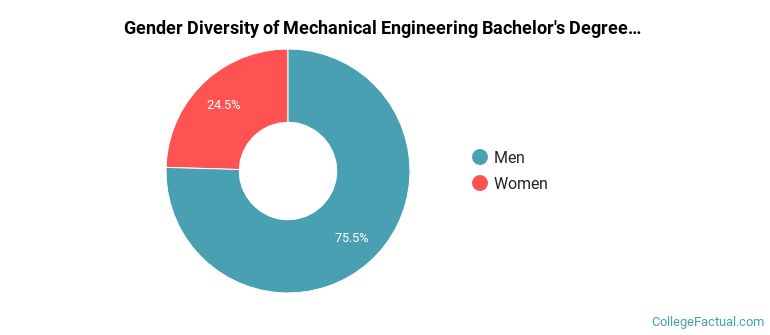
For the most recent academic year available, 75% of me bachelor's degrees went to men and 25% went to women.
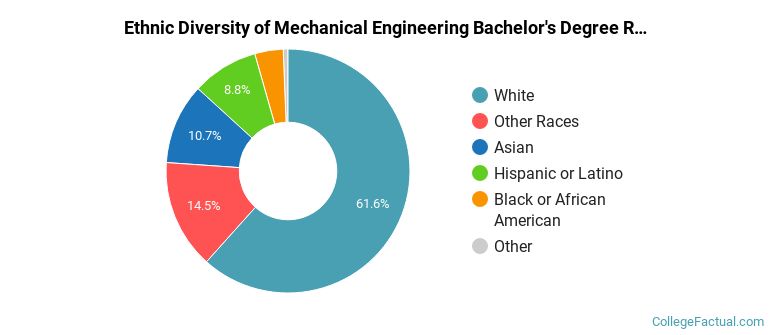
The majority of bachelor's degree recipients in this major at Stevens are white. In the most recent graduating class for which data is available, 62% of students fell into this category.
The following table and chart show the ethnic background for students who recently graduated from Stevens Institute of Technology with a bachelor's in me.
| Ethnic Background | Number of Students |
|---|---|
| Asian | 17 |
| Black or African American | 6 |
| Hispanic or Latino | 14 |
| White | 98 |
| Non-Resident Aliens | 1 |
| Other Races | 23 |
Stevens does not offer an online option for its me bachelor’s degree program at this time. To see if the school offers distance learning options in other areas, visit the Stevens Online Learning page.
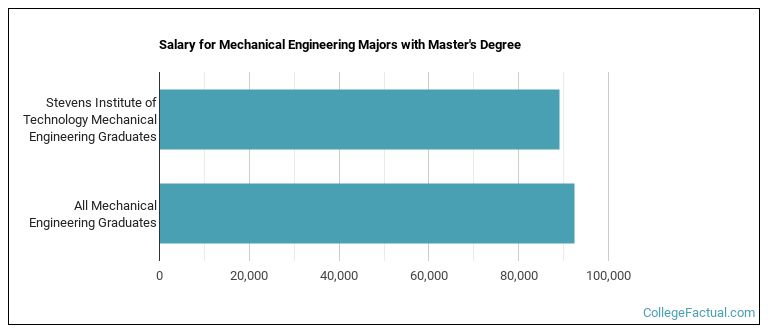
Graduates of the master's me program at Stevens make a median salary of $89,060. This is less than what their typical peers from other schools make. Their median salary is $92,526.
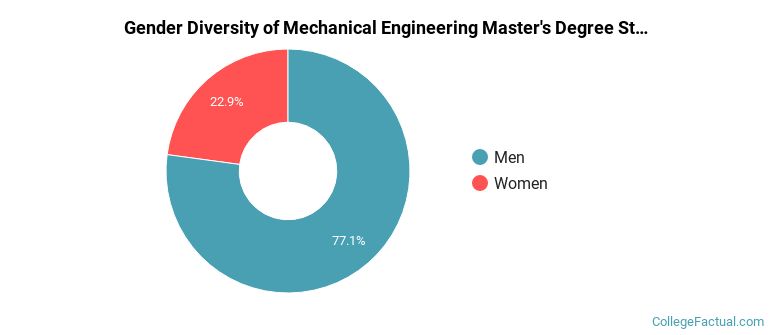
Of the 70 me students who graduated with a master's degree in 2021-2022 from Stevens, about 77% were men and 23% were women.
The majority of master's degree recipients in this major at Stevens are white. In the most recent graduating class for which data is available, 53% of students fell into this category.
The following table and chart show the ethnic background for students who recently graduated from Stevens Institute of Technology with a master's in me.
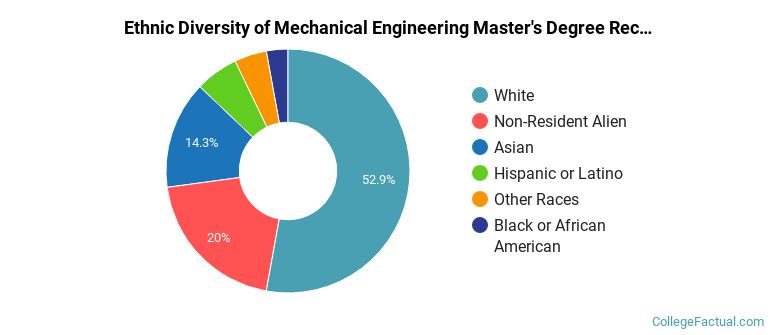
| Ethnic Background | Number of Students |
|---|---|
| Asian | 10 |
| Black or African American | 2 |
| Hispanic or Latino | 4 |
| White | 37 |
| Non-Resident Aliens | 14 |
| Other Races | 3 |
Take a look at the following statistics related to the make-up of the me majors at Stevens Institute of Technology.
| Related Major | Annual Graduates |
|---|---|
| Systems Engineering | 307 |
| Computer Engineering | 186 |
| Biomedical Engineering | 103 |
| Electrical Engineering | 95 |
| Civil Engineering | 57 |
More about our data sources and methodologies.