Explore the best ranked schools for the programs you are most interested in.
Stillman College was not ranked in College Factual's 2025 Best Overall Colleges report. This could be for a number of reasons, including lack of data.
The acceptance rate at Stillman College is a competitive 65%, so make sure you take your application seriously when putting it together. Even leaving out a minor detail could be a reason to move you to the rejection pile.
With a student to faculty ratio of 15 to 1, Stillman College is about average in this regard as the nationwide rate is 15 to 1. While this does not translate directly to class size, it's a good indicator of how much time professors will have to spend with their students on a one-on-one basis.
In addition to the student to faculty ratio, some people look at what percentage of faculty members are full-time as a sign of how much time professors will be able to spend with their students. This is because part-time teachers may not be be on campus as much as their full-time counterparts.
The full-time faculty percentage at Stillman College is 58%. This is higher than the national average of 47%.
The freshmen retention rate tells us what percentage of first-year, full-time students choose to continue on to their sophomore year at a particular school. The rate at Stillman College is 63%, which is about average when compared to the national rate of 68%.
When we say that a student has graduated on time, we mean that they have finished their bachelor's degree within four years. The on-time graduation rate at Stillman College is 10%. That's lower than the national rate of 33.3%
Find out more about the retention and graduation rates at Stillman College.
During the 2017-2018 academic year, there were 712 undergraduates at Stillman College with 650 being full-time and 62 being part-time.
| $0-30 K | $30K-48K | $48-75 | $75-110K | $110K + |
|---|---|---|---|---|
| $15,446 | $15,874 | $17,667 | $24,823 | $16,894 |
The net price is calculated by adding tuition, room, board and other costs and subtracting financial aid.Note that the net price is typically less than the published for a school. For more information on the sticker price of Stillman College, see our tuition and fees and room and board pages.
Almost 66% of college students who graduated with the class of 2018 took out student loans, but that percentage varies from school to school. At Stillman College, approximately 61% of students took out student loans averaging $6,158 a year. That adds up to $24,632 over four years for those students.
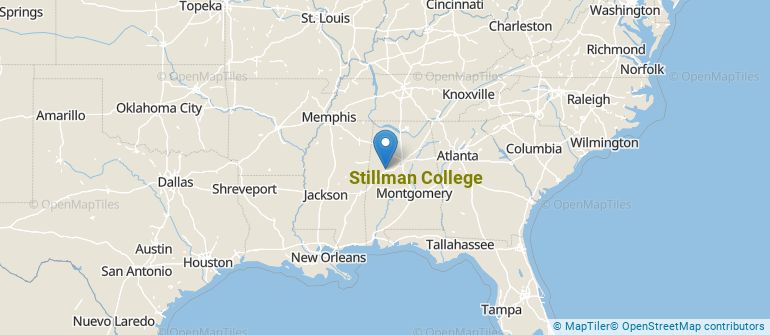
Get more details about the location of Stillman College.
Contact details for Stillman College are given below.
| Contact Details | |
|---|---|
| Address: | 3601 Stillman Boulevard, Tuscaloosa, AL 35401 |
| Phone: | 205-349-4240 |
| Website: | https://stillman.edu/ |
| Facebook: | https://www.facebook.com/stillman.tuscaloosa |
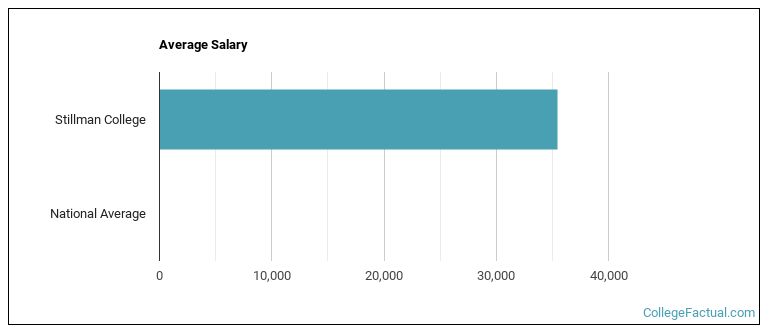
| Most Popular Majors | Bachelor’s Degrees | Average Salary of Graduates |
|---|---|---|
| General Business/Commerce | 28 | NA |
| Teacher Education Subject Specific | 17 | NA |
| General Psychology | 11 | NA |
| General Biology | 10 | NA |
| Liberal Arts General Studies | 9 | NA |
| Criminal Justice & Corrections | 6 | NA |
| Special Education | 5 | NA |
| Theological & Ministerial Studies | 5 | NA |
| Mathematics | 4 | NA |
| General English Literature | 3 | NA |
Online learning options are becoming more and more popular at American colleges and universities. Online classes are great for students who have busy schedules or for those who just want to study on their own time.
In 2022-2023, 703 students took at least one online class at Stillman College. This is an increase from the 515 students who took online classes the previous year.
| Year | Took at Least One Online Class | Took All Classes Online |
|---|---|---|
| 2022-2023 | 703 | 223 |
| 2021-2022 | 515 | 222 |
| 2020-2021 | 669 | 134 |
| 2018-2019 | 385 | 43 |
If you’re considering Stillman College, here are some more schools you may be interested in knowing more about.
Curious on how these schools stack up against Stillman College? Pit them head to head with College Combat, our free interactive tool that lets you compare college on the features that matter most to you!
Footnotes
*The racial-ethnic minorities count is calculated by taking the total number of students and subtracting white students, international students, and students whose race/ethnicity was unknown. This number is then divided by the total number of students at the school to obtain the racial-ethnic minorities percentage.
References
More about our data sources and methodologies.