Here, you'll find out more about the major, including such details as the number of graduates, what degree levels are offered, ethnicity of students, and more. In addition, we cover how Suffolk County Community College ranks in comparison to other schools with legal support programs.
Jump to any of the following sections:
The bachelor's program at Suffolk County Community College was ranked #61 on College Factual's Best Schools for legal support list.
In 2022-2023, the average part-time undergraduate tuition at Suffolk County Community College was $456 per credit hour for out-of-state students. The average for in-state students was $235 per credit hour. The following table shows the average full-time tuition and fees for undergraduates.
| In State | Out of State | |
|---|---|---|
| Tuition | $5,640 | $11,280 |
| Fees | $800 | $800 |
| Books and Supplies | $1,500 | $1,500 |
Learn more about Suffolk County Community College tuition and fees.
Suffolk County Community College does not offer an online option for its legal support bachelor’s degree program at this time. To see if the school offers distance learning options in other areas, visit the Suffolk County Community College Online Learning page.
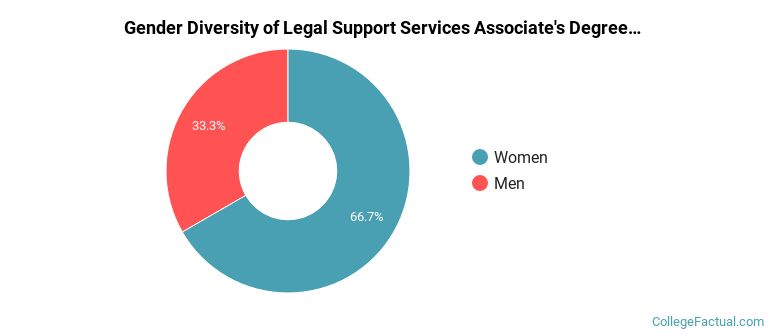
During the 2021-2022 academic year, 12 legal support majors earned their associate's degree from Suffolk County Community College. Of these graduates, 33% were men and 67% were women.
The following table and chart show the ethnic background for students who recently graduated from Suffolk County Community College with a associate's in legal support.
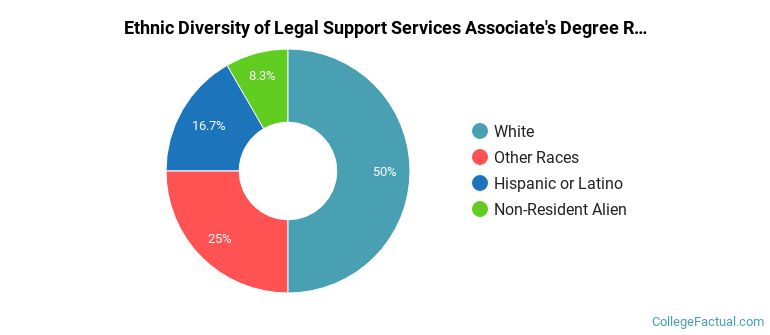
| Ethnic Background | Number of Students |
|---|---|
| Asian | 0 |
| Black or African American | 0 |
| Hispanic or Latino | 2 |
| White | 6 |
| Non-Resident Aliens | 1 |
| Other Races | 3 |