Suffolk total enrollment is approximately 6,830 students. 4,179 are undergraduates and 1,299 are graduate students.
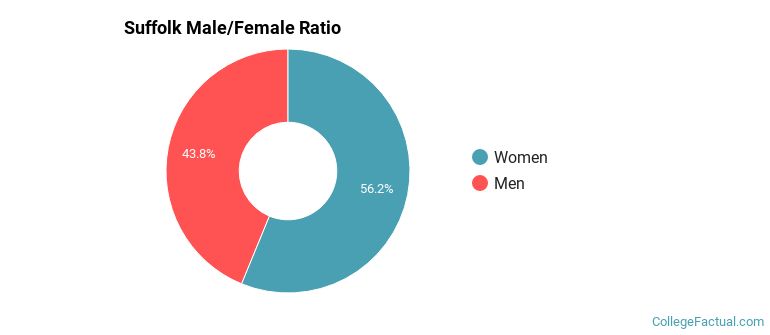
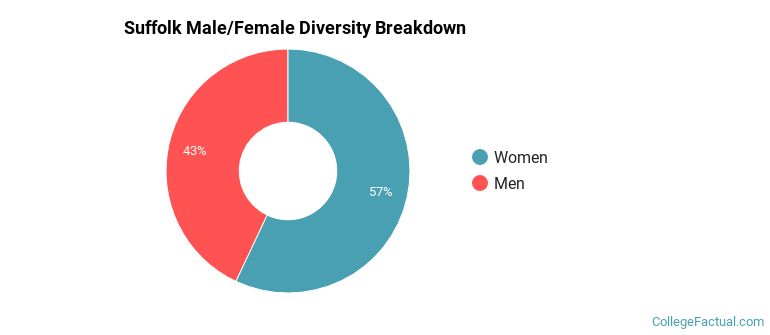
Male/Female Breakdown of Undergraduates
The full-time Suffolk undergraduate population is made up of 58% women, and 42% men.
For the gender breakdown for all students, go here.
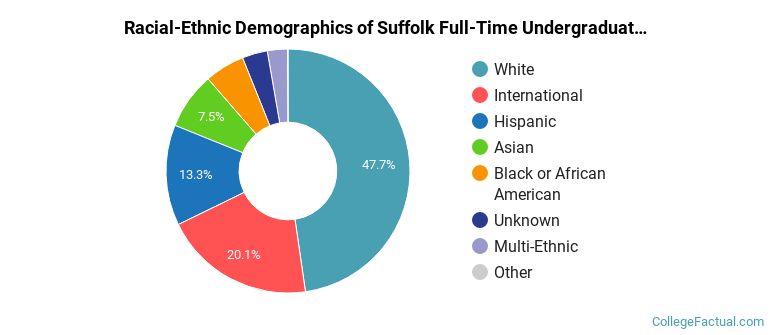
Suffolk Racial/Ethnic Breakdown of Undergraduates
| Race/Ethnicity | Number |
|---|---|
| White | 2,069 |
| International | 705 |
| Hispanic | 594 |
| Asian | 321 |
| Black or African American | 230 |
| Unknown | 139 |
| Multi-Ethnic | 112 |
| Native Hawaiian or Pacific Islander | 1 |
See racial/ethnic breakdown for all students.
Male/Female Breakdown of Graduate Students
About 61% of full-time grad students are women, and 39% men.

For the gender breakdown for all students, go here.
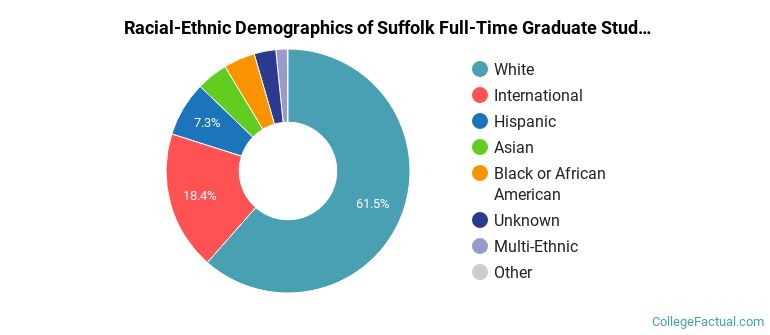
Suffolk Racial-Ethnic Breakdown of Graduate Students
| Race/Ethnicity | Number |
|---|---|
| White | 815 |
| International | 201 |
| Hispanic | 99 |
| Asian | 68 |
| Black or African American | 63 |
| Unknown | 35 |
| Multi-Ethnic | 18 |
| Native Hawaiian or Pacific Islander | 0 |
See racial/ethnic breakdown for all students.
| Race/Ethnicity | Number |
|---|---|
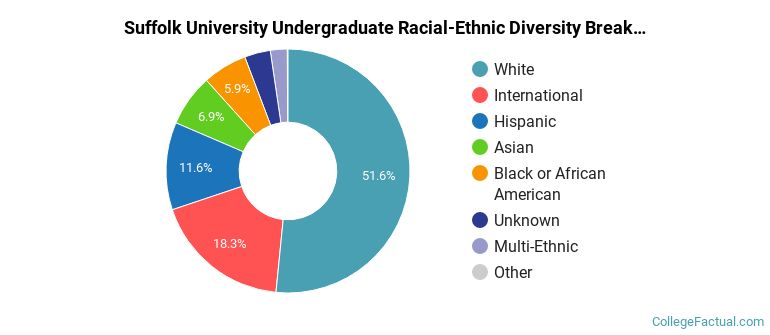
| White | 3,669 |
| International | 1,036 |
| Hispanic | 826 |
| Asian | 496 |
| Black or African American | 422 |
| Unknown | 215 |
| Multi-Ethnic | 154 |
| Native Hawaiian or Pacific Islander | 1 |
There are approximately 4,003 female students and 2,827 male students at Suffolk.
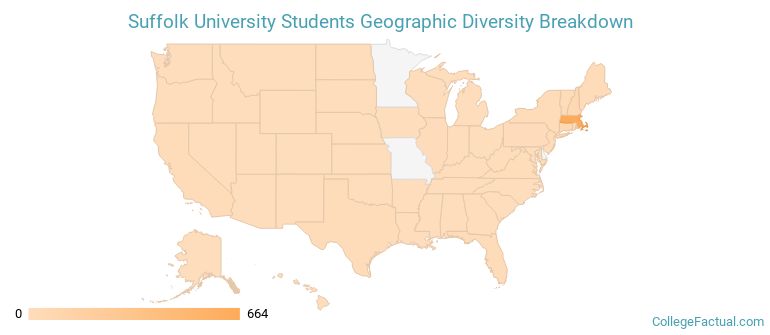
Suffolk ranks 576 out of 2,183 when it comes to geographic diversity.
33.06% of Suffolk students come from out of state, and 15.26% come from out of the country.
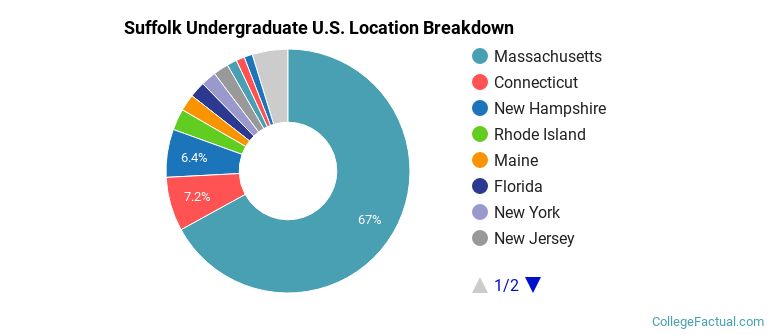
The undergraduate student body is split among 29 states (may include Washington D.C.). Click on the map for more detail.
| State | Amount |
|---|---|
| Massachusetts | 664 |
| Connecticut | 71 |
| New Hampshire | 63 |
| Rhode Island | 28 |
| Maine | 22 |
Students from 112 countries are represented at this school, with the majority of the international students coming from China, Saudi Arabia, and Vietnam.
Learn more about international students at Suffolk.
A traditional college student is defined as being between the ages of 18-21. At Suffolk, 50.69% of students fall into that category, compared to the national average of 60%.
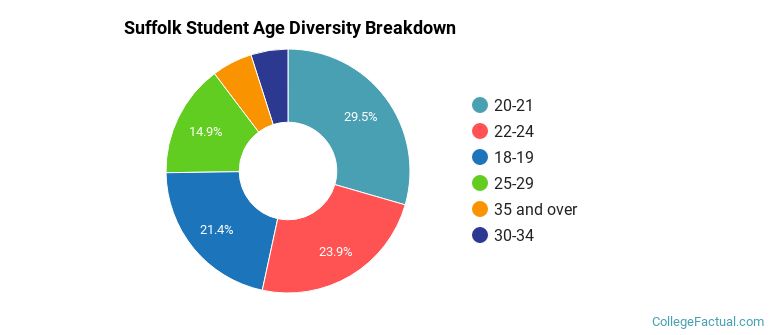
| Student Age Group | Amount |
|---|---|
| 20-21 | 2,115 |
| 22-24 | 1,715 |
| 18-19 | 1,535 |
| 25-29 | 1,071 |
| 35 and over | 386 |
| 30-34 | 353 |
| Under 18 | 0 |
Footnotes
*The racial-ethnic minorities count is calculated by taking the total number of students and subtracting white students, international students, and students whose race/ethnicity was unknown. This number is then divided by the total number of students at the school to obtain the racial-ethnic minorities percentage.
References
Department of Homeland Security Citizenship and Immigration Services
Read College Factual's Diversity Ranking Methodology.