Here is an overview of this program at SUNY at Albany. You can study it at the Bachelor’s level, with graduate study also available. Its best result is a rank of #6 out of 8 schools (Bachelor’s level) by College Factual. Jump to any of the following sections:
By College Factual’s measure, SUNY at Albany highly for ethnic studies, ranked #86 out of 124 schools nationally.Ranking Rank Best Ethnic Studies Schools 86 of 124 Best Ethnic Studies Schools in New York 6 of 9 Best Ethnic Studies Schools in the Middle Atlantic Region 14 of 20
Here is each degree level granted in ethnic studies at SUNY at Albany, along with how many graduates complete each level annually.Degree Level Annual Graduates Bachelor’s 23 Master’s 12
In the most recent year for which we have data, University at Albany handed out 23 bachelor’s degrees in ethnic studies.
SUNY at Albany is a solid choice among schools offering ethnic studies at the bachelor’s level. Its best result was #6 out of 8 schools by College Factual.
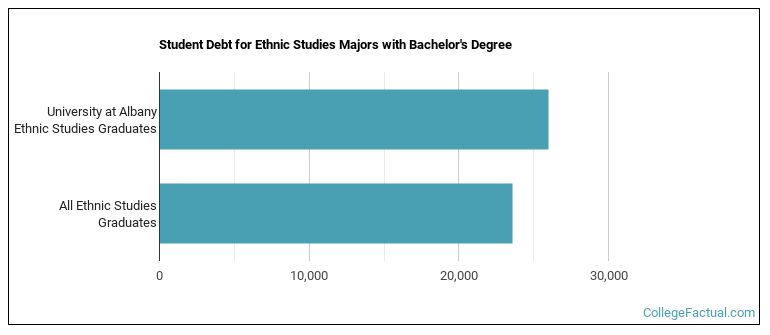
To complete a bachelor’s at SUNY at Albany, ethnic studies graduates take on a median debt of $26,000 in student loans. This is higher than $23,564, the typical median for all majors at SUNY at Albany.
Average full-time tuition and fees are listed in the table below.In State Out of State Tuition $7,070 $27,460 Fees $3,531 $3,531
Read more about SUNY at Albany tuition and fees.
For the most recent academic year available, 22% of ethnic studies bachelor’s degrees went to men and 78% went to women.
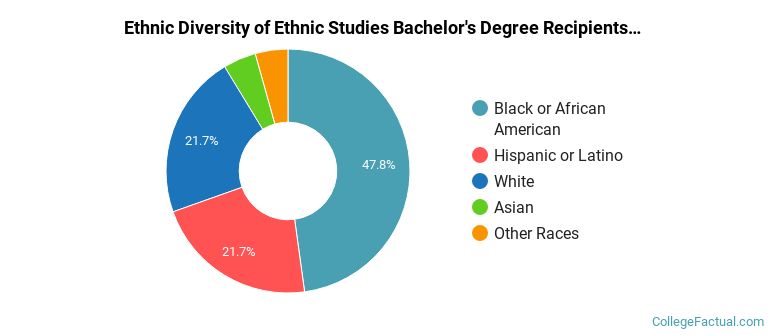
 The largest share of ethnic studies bachelor’s degree graduates at SUNY at Albany are Black or African American. Roughly 48% of graduates fell into this category.
The following table and chart show the ethnic background for students who recently graduated from University at Albany with a bachelor’s in ethnic studies.
| Ethnic Background | Number of Students |
|---|---|
| Asian | 1 |
| Black or African American | 11 |
| Hispanic or Latino | 5 |
| White | 5 |
| Non-Resident Aliens | 0 |
| Other Races | 1 |
SUNY at Albany granted 12 bachelor’s degrees in women’s studies recently — 83% to women and 17% to men. The most common background among these graduates was White (42%).
SUNY at Albany granted 11 bachelor’s completions in african-american/black studies recently — 73% to women and 27% to men. The most common background among these graduates was Black or African American (82%).
This program is also offered at the graduate level at SUNY at Albany. The following graduate award levels are reported.Graduate Level Annual Graduates Master’s Degrees in Ethnic Studies 12