We've pulled together some essential information you should know about the program, including how many students graduate each year, the ethnic diversity of these students, average starting salaries, and more. In addition, we cover how SUNY Fredonia ranks in comparison to other schools with subject specific ed programs.
Go directly to any of the following sections:
The bachelor's program at SUNY Fredonia was ranked #130 on College Factual's Best Schools for subject specific ed list. It is also ranked #18 in New York.
During the 2021-2022 academic year, SUNY Fredonia handed out 87 bachelor's degrees in teacher education subject specific. This is a decrease of 1% over the previous year when 88 degrees were handed out.
In 2022, 38 students received their master’s degree in subject specific ed from SUNY Fredonia. This makes it the #124 most popular school for subject specific ed master’s degree candidates in the country.
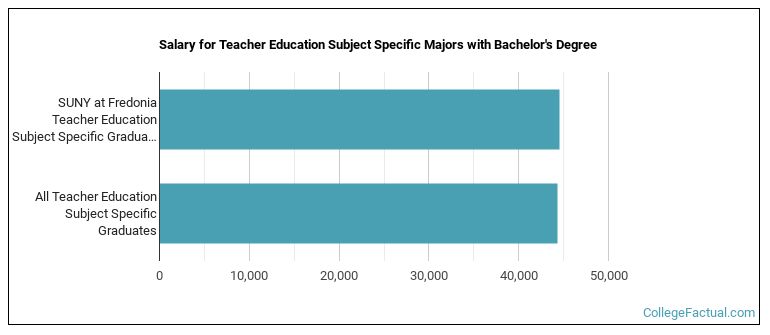
Subject Specific Ed majors who earn their bachelor's degree from SUNY Fredonia go on to jobs where they make a median salary of $36,276 a year. Unfortunately, this is lower than the national average of $43,086 for all subject specific ed students.
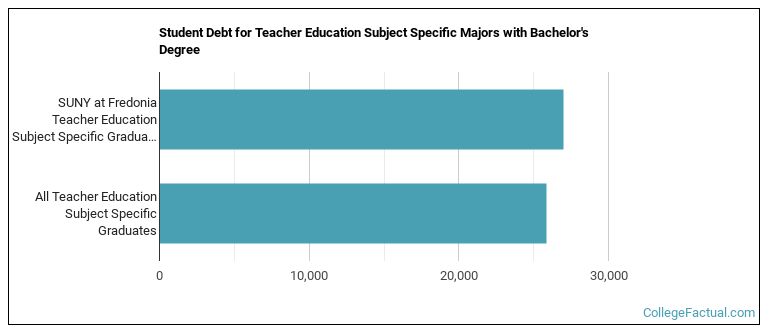
While getting their bachelor's degree at SUNY Fredonia, subject specific ed students borrow a median amount of $32,339 in student loans. This is higher than the the typical median of $26,530 for all subject specific ed majors across the country.
In 2022-2023, the average part-time undergraduate tuition at SUNY Fredonia was $729 per credit hour for out-of-state students. The average for in-state students was $295 per credit hour. The average full-time tuition and fees for undergraduates are shown in the table below.
| In State | Out of State | |
|---|---|---|
| Tuition | $7,070 | $17,490 |
| Fees | $1,701 | $1,701 |
| Books and Supplies | $1,150 | $1,150 |
| On Campus Room and Board | $14,830 | $14,830 |
| On Campus Other Expenses | $1,950 | $1,950 |
Learn more about SUNY Fredonia tuition and fees.
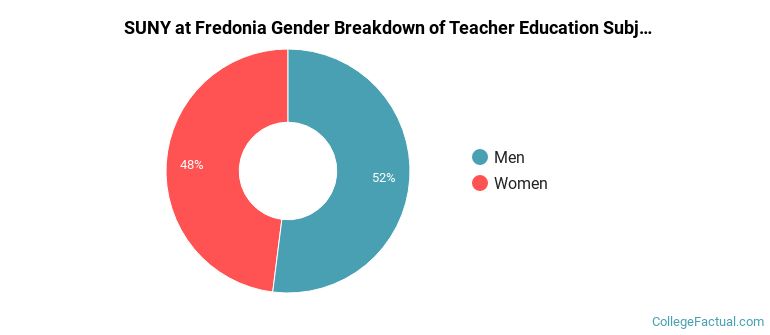
Of the 87 subject specific ed students who graduated with a bachelor's degree in 2021-2022 from SUNY Fredonia, about 41% were men and 59% were women.
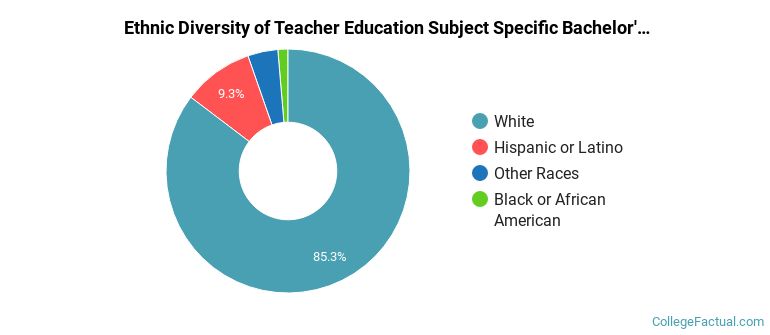
The majority of bachelor's degree recipients in this major at SUNY Fredonia are white. In the most recent graduating class for which data is available, 82% of students fell into this category.
The following table and chart show the ethnic background for students who recently graduated from SUNY Fredonia with a bachelor's in subject specific ed.
| Ethnic Background | Number of Students |
|---|---|
| Asian | 0 |
| Black or African American | 1 |
| Hispanic or Latino | 11 |
| White | 71 |
| Non-Resident Aliens | 0 |
| Other Races | 4 |
Online degrees for the SUNY Fredonia subject specific ed bachelor’s degree program are not available at this time. To see if the school offers distance learning options in other areas, visit the SUNY Fredonia Online Learning page.
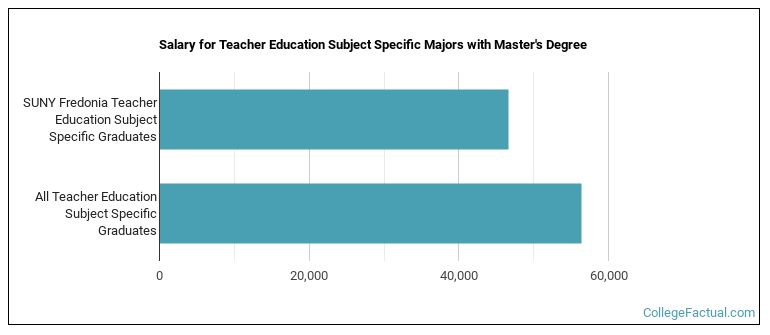
Subject Specific Ed majors graduating with a master's degree from SUNY Fredonia make a median salary of $46,636 a year. This is less than what their typical peers from other schools make. Their median salary is $56,457.
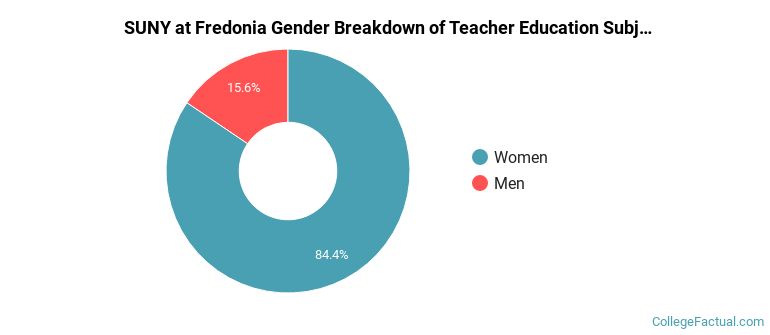
During the 2021-2022 academic year, 30 subject specific ed majors earned their master's degree from SUNY Fredonia. Of these graduates, 13% were men and 87% were women.
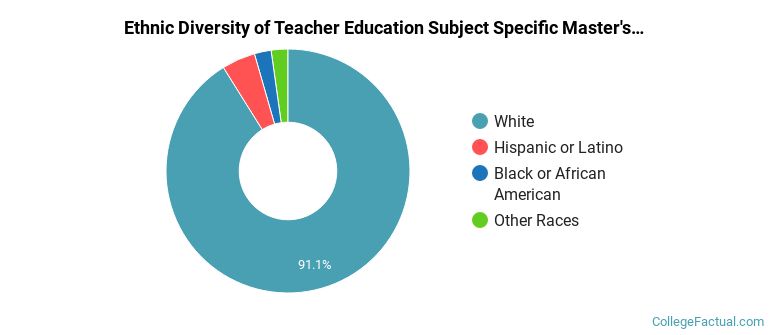
The majority of the students with this major are white. About 83% of 2022 graduates were in this category.
The following table and chart show the ethnic background for students who recently graduated from SUNY Fredonia with a master's in subject specific ed.
| Ethnic Background | Number of Students |
|---|---|
| Asian | 1 |
| Black or African American | 0 |
| Hispanic or Latino | 2 |
| White | 25 |
| Non-Resident Aliens | 0 |
| Other Races | 2 |
Take a look at the following statistics related to the make-up of the subject specific ed majors at SUNY Fredonia.
| Related Major | Annual Graduates |
|---|---|
| Teacher Education Grade Specific | 41 |
| Special Education | 36 |
| Teaching English or French | 14 |
| Curriculum & Instruction | 10 |
| Educational Administration | 6 |
View All Teacher Education Subject Specific Related Majors >