SUNY Fredonia total enrollment is approximately 4,055 students. 3,738 are undergraduates and 129 are graduate students.
Male/Female Breakdown of Undergraduates
The full-time SUNY Fredonia undergraduate population is made up of 59% women, and 41% men.

For the gender breakdown for all students, go here.
SUNY Fredonia Racial/Ethnic Breakdown of Undergraduates

| Race/Ethnicity | Number |
|---|---|
| White | 2,722 |
| Hispanic | 364 |
| Black or African American | 311 |
| Multi-Ethnic | 150 |
| Asian | 64 |
| International | 62 |
| Unknown | 42 |
| Native Hawaiian or Pacific Islander | 2 |
See racial/ethnic breakdown for all students.
Male/Female Breakdown of Graduate Students
About 76% of full-time grad students are women, and 24% men.

For the gender breakdown for all students, go here.
SUNY Fredonia Racial-Ethnic Breakdown of Graduate Students

| Race/Ethnicity | Number |
|---|---|
| White | 98 |
| International | 12 |
| Hispanic | 9 |
| Multi-Ethnic | 4 |
| Black or African American | 3 |
| Unknown | 1 |
| Asian | 0 |
| Native Hawaiian or Pacific Islander | 0 |
See racial/ethnic breakdown for all students.

| Race/Ethnicity | Number |
|---|---|
| White | 2,953 |
| Hispanic | 394 |
| Black or African American | 321 |
| Multi-Ethnic | 157 |
| International | 88 |
| Asian | 66 |
| Unknown | 49 |
| Native Hawaiian or Pacific Islander | 2 |
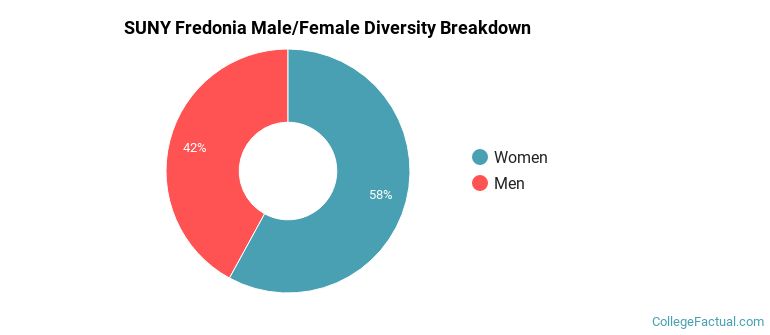
There are approximately 2,408 female students and 1,647 male students at SUNY Fredonia.
SUNY Fredonia ranks 1,614 out of 2,183 when it comes to geographic diversity.
3.79% of SUNY Fredonia students come from out of state, and 0.86% come from out of the country.

The undergraduate student body is split among 18 states (may include Washington D.C.). Click on the map for more detail.

| State | Amount |
|---|---|
| New York | 888 |
| Pennsylvania | 6 |
| New Jersey | 5 |
| Connecticut | 3 |
| Massachusetts | 3 |
Learn more about international students at SUNY Fredonia.
A traditional college student is defined as being between the ages of 18-21. At SUNY Fredonia, 76.33% of students fall into that category, compared to the national average of 60%.

| Student Age Group | Amount |
|---|---|
| 18-19 | 1,779 |
| 20-21 | 1,755 |
| 22-24 | 774 |
| 25-29 | 170 |
| 35 and over | 82 |
| 30-34 | 40 |
| Under 18 | 0 |
Footnotes
*The racial-ethnic minorities count is calculated by taking the total number of students and subtracting white students, international students, and students whose race/ethnicity was unknown. This number is then divided by the total number of students at the school to obtain the racial-ethnic minorities percentage.
References
Department of Homeland Security Citizenship and Immigration Services
Find out how College Factual created their Diversity Rankings.