SUNY Brockport total enrollment is approximately 7,592 students. 5,482 are undergraduates and 356 are graduate students.
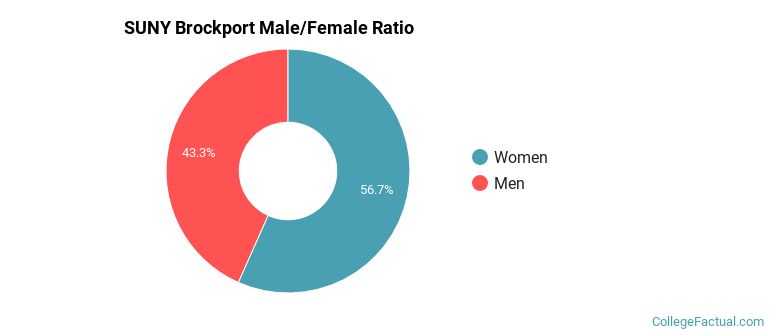
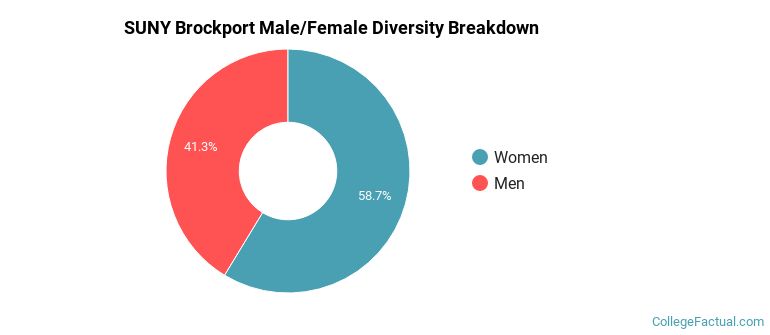
Male/Female Breakdown of Undergraduates
The full-time SUNY Brockport undergraduate population is made up of 57% women, and 43% men.
For the gender breakdown for all students, go here.
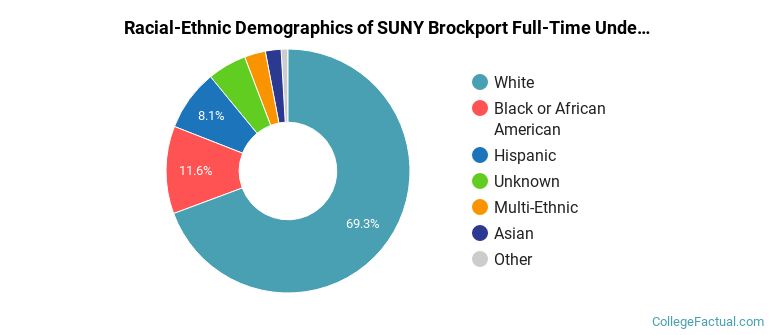
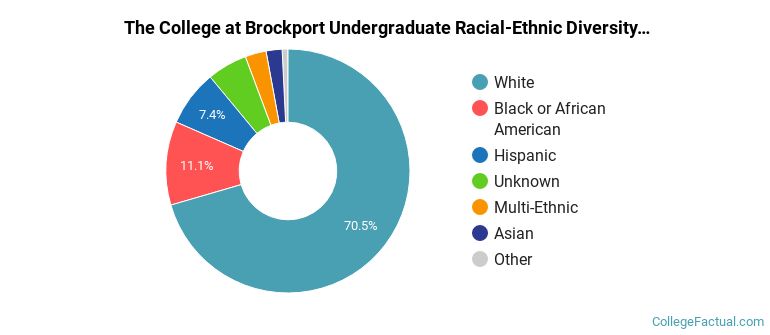
SUNY Brockport Racial/Ethnic Breakdown of Undergraduates
| Race/Ethnicity | Number |
|---|---|
| White | 3,797 |
| Black or African American | 646 |
| Hispanic | 469 |
| Unknown | 228 |
| Multi-Ethnic | 169 |
| Asian | 120 |
| International | 38 |
| Native Hawaiian or Pacific Islander | 2 |
See racial/ethnic breakdown for all students.
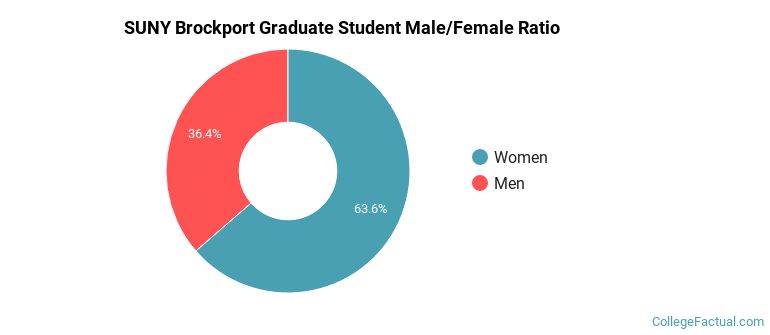
Male/Female Breakdown of Graduate Students
About 69% of full-time grad students are women, and 31% men.
For the gender breakdown for all students, go here.
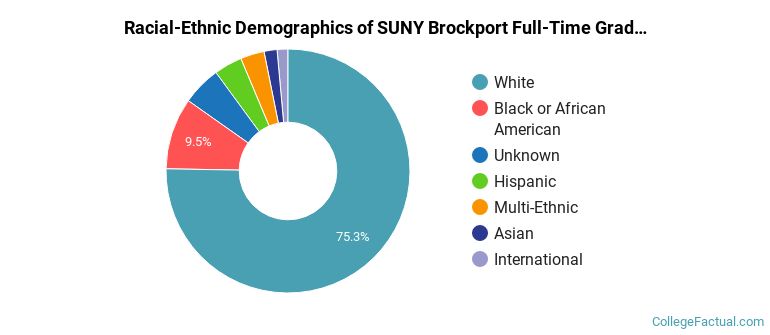
SUNY Brockport Racial-Ethnic Breakdown of Graduate Students
| Race/Ethnicity | Number |
|---|---|
| White | 284 |
| Black or African American | 33 |
| Hispanic | 14 |
| Unknown | 10 |
| Multi-Ethnic | 8 |
| Asian | 5 |
| International | 2 |
| Native Hawaiian or Pacific Islander | 0 |
See racial/ethnic breakdown for all students.
| Race/Ethnicity | Number |
|---|---|
| White | 5,354 |
| Black or African American | 854 |
| Hispanic | 587 |
| Unknown | 351 |
| Multi-Ethnic | 223 |
| Asian | 158 |
| International | 44 |
| Native Hawaiian or Pacific Islander | 5 |
There are approximately 4,561 female students and 3,031 male students at SUNY Brockport.
SUNY Brockport ranks 1,770 out of 2,183 when it comes to geographic diversity.
2.26% of SUNY Brockport students come from out of state, and 0.66% come from out of the country.
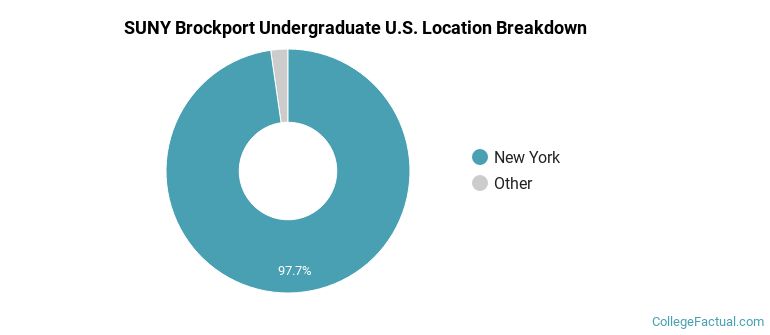
The undergraduate student body is split among 13 states (may include Washington D.C.). Click on the map for more detail.
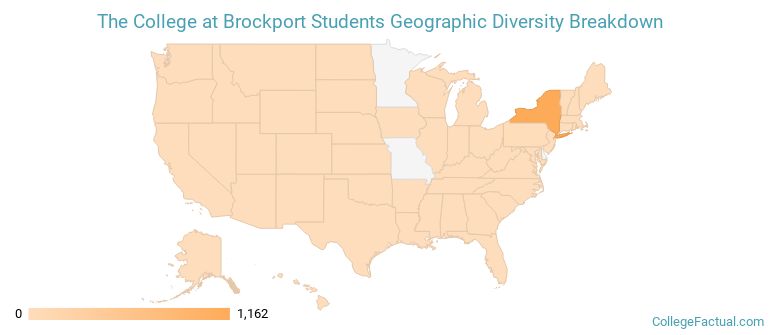
| State | Amount |
|---|---|
| New York | 1,162 |
| Pennsylvania | 9 |
| New Hampshire | 3 |
| New Jersey | 3 |
| Ohio | 3 |
Learn more about international students at SUNY Brockport.
A traditional college student is defined as being between the ages of 18-21. At SUNY Brockport, 56.25% of students fall into that category, compared to the national average of 60%.
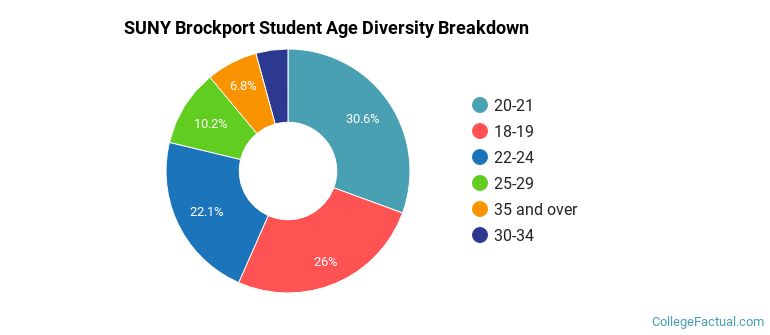
| Student Age Group | Amount |
|---|---|
| 20-21 | 2,527 |
| 18-19 | 2,149 |
| 22-24 | 1,829 |
| 25-29 | 841 |
| 35 and over | 563 |
| 30-34 | 351 |
| Under 18 | 0 |
Footnotes
*The racial-ethnic minorities count is calculated by taking the total number of students and subtracting white students, international students, and students whose race/ethnicity was unknown. This number is then divided by the total number of students at the school to obtain the racial-ethnic minorities percentage.
References
Department of Homeland Security Citizenship and Immigration Services
Image Credit: By DanielPenfield under License
Find out how College Factual created their Diversity Rankings.