We've gathered data and other essential information about the program, such as the average salary of graduates, ethnicity of students, how many students graduated in recent times, and more. We've also included details on how SUNY Cortland ranks compared to other colleges offering a major in grade specific ed.
Go directly to any of the following sections:
SUNY Cortland is in the top 10% of the country for grade specific ed. More specifically it was ranked #68 out of 783 schools by College Factual. It is also ranked #4 in New York.
During the 2021-2022 academic year, SUNY Cortland handed out 138 bachelor's degrees in teacher education grade specific. This is a decrease of 19% over the previous year when 171 degrees were handed out.
In 2022, 16 students received their master’s degree in grade specific ed from SUNY Cortland. This makes it the #369 most popular school for grade specific ed master’s degree candidates in the country.
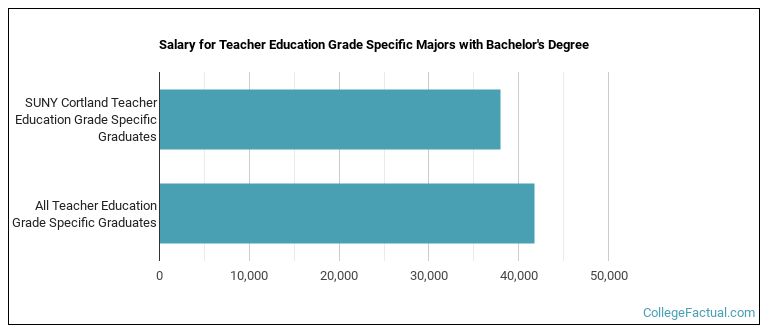
Grade Specific Ed majors who earn their bachelor's degree from SUNY Cortland go on to jobs where they make a median salary of $37,979 a year. Unfortunately, this is lower than the national average of $41,809 for all grade specific ed students.
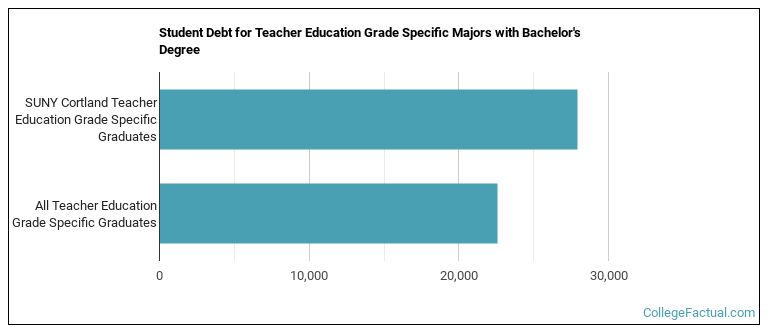
While getting their bachelor's degree at SUNY Cortland, grade specific ed students borrow a median amount of $27,931 in student loans. This is higher than the the typical median of $22,604 for all grade specific ed majors across the country.
The typical student loan payment of a bachelor's degree student from the grade specific ed program at SUNY Cortland is $277 per month.
Out-of-state part-time undergraduates at SUNY Cortland paid an average of $708 per credit hour in 2022-2023. The average for in-state students was $295 per credit hour. Information about average full-time undergraduate tuition and fees is shown in the table below.
| In State | Out of State | |
|---|---|---|
| Tuition | $7,070 | $16,980 |
| Fees | $1,745 | $1,745 |
| Books and Supplies | $1,200 | $1,200 |
| On Campus Room and Board | $15,210 | $15,210 |
| On Campus Other Expenses | $3,050 | $3,050 |
Learn more about SUNY Cortland tuition and fees.
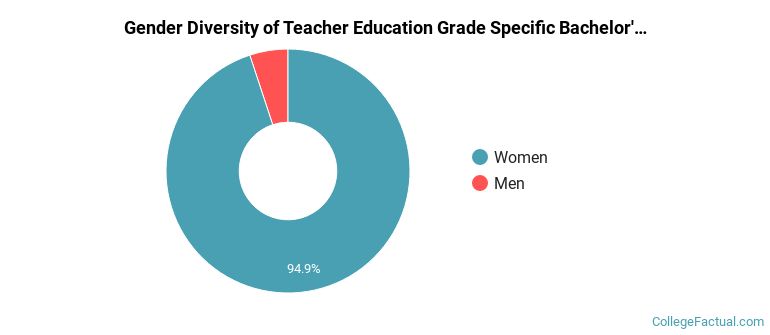
The grade specific ed program at SUNY Cortland awarded 138 bachelor's degrees in 2021-2022. About 5% of these degrees went to men with the other 95% going to women.
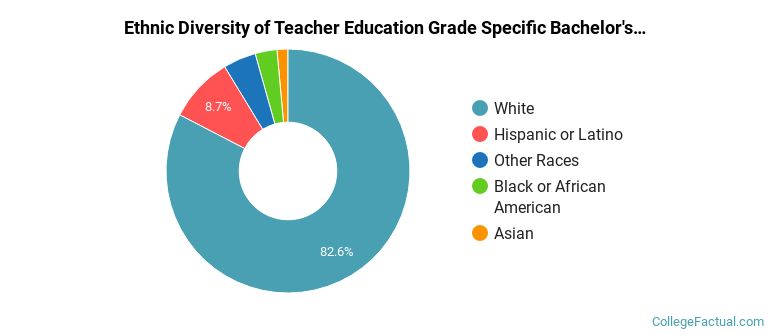
The majority of bachelor's degree recipients in this major at SUNY Cortland are white. In the most recent graduating class for which data is available, 83% of students fell into this category.
The following table and chart show the ethnic background for students who recently graduated from SUNY Cortland with a bachelor's in grade specific ed.
| Ethnic Background | Number of Students |
|---|---|
| Asian | 2 |
| Black or African American | 4 |
| Hispanic or Latino | 12 |
| White | 114 |
| Non-Resident Aliens | 0 |
| Other Races | 6 |
Online degrees for the SUNY Cortland grade specific ed bachelor’s degree program are not available at this time. To see if the school offers distance learning options in other areas, visit the SUNY Cortland Online Learning page.
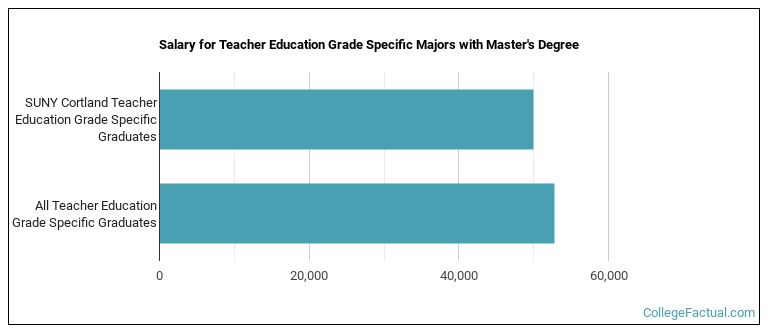
Grade Specific Ed majors graduating with a master's degree from SUNY Cortland make a median salary of $49,974 a year. This is less than what their typical peers from other schools make. Their median salary is $52,763.
Of the 10 students who earned a master's degree in Teacher Education Grade Specific from SUNY Cortland in 2021-2022, 10% were men and 90% were women.

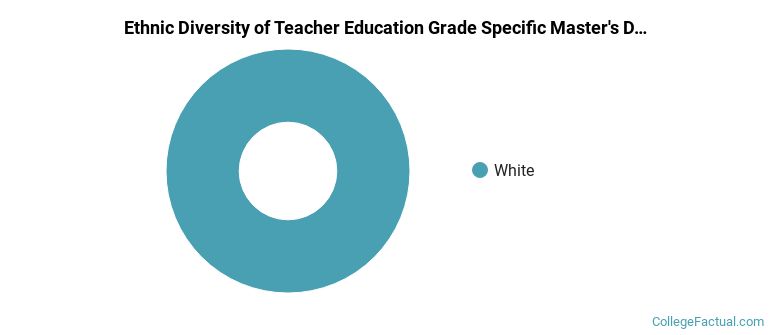
The majority of master's degree recipients in this major at SUNY Cortland are white. In the most recent graduating class for which data is available, 100% of students fell into this category.
The following table and chart show the ethnic background for students who recently graduated from SUNY Cortland with a master's in grade specific ed.
| Ethnic Background | Number of Students |
|---|---|
| Asian | 0 |
| Black or African American | 0 |
| Hispanic or Latino | 0 |
| White | 10 |
| Non-Resident Aliens | 0 |
| Other Races | 0 |
Take a look at the following statistics related to the make-up of the grade specific ed majors at SUNY Cortland.
| Related Major | Annual Graduates |
|---|---|
| Teacher Education Subject Specific | 314 |
| Special Education | 110 |
| Educational Administration | 48 |
| Teaching English or French | 16 |
More about our data sources and methodologies.