ESF total enrollment is approximately 2,127 students. 1,625 are undergraduates and 225 are graduate students.
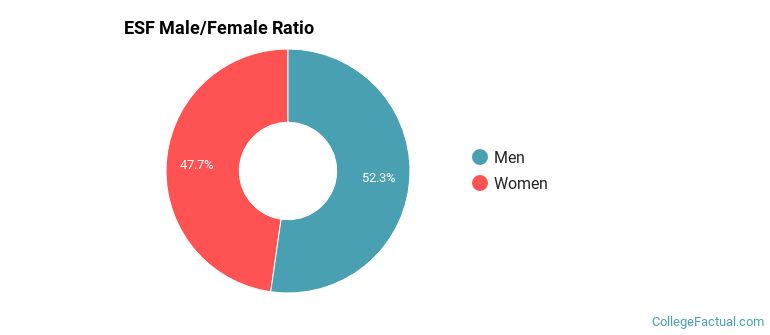
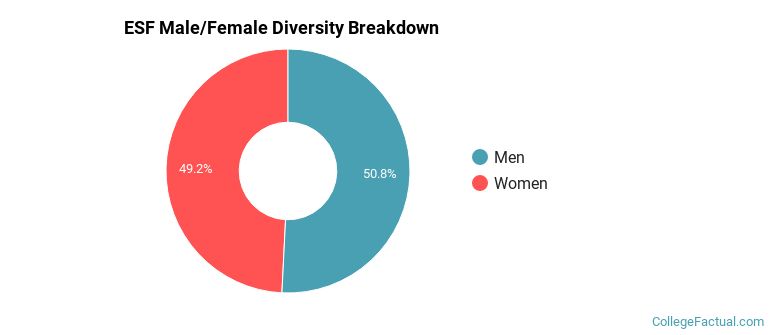
Male/Female Breakdown of Undergraduates
The full-time ESF undergraduate population is made up of 47% women, and 53% men.
For the gender breakdown for all students, go here.
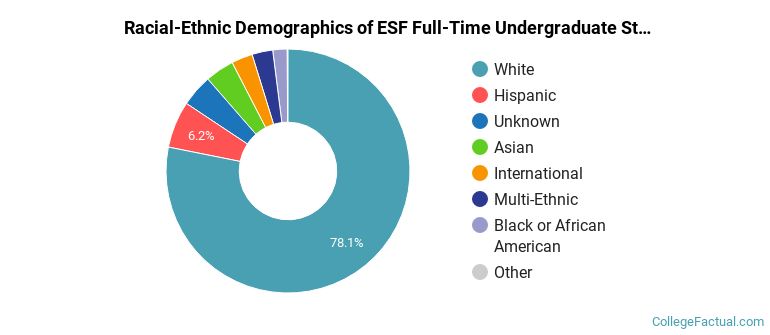
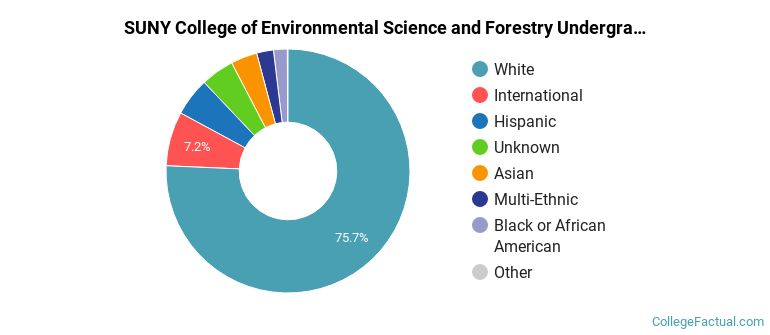
ESF Racial/Ethnic Breakdown of Undergraduates
| Race/Ethnicity | Number |
|---|---|
| White | 1,263 |
| Hispanic | 109 |
| Asian | 65 |
| Unknown | 62 |
| Multi-Ethnic | 52 |
| International | 37 |
| Black or African American | 35 |
| Native Hawaiian or Pacific Islander | 0 |
See racial/ethnic breakdown for all students.
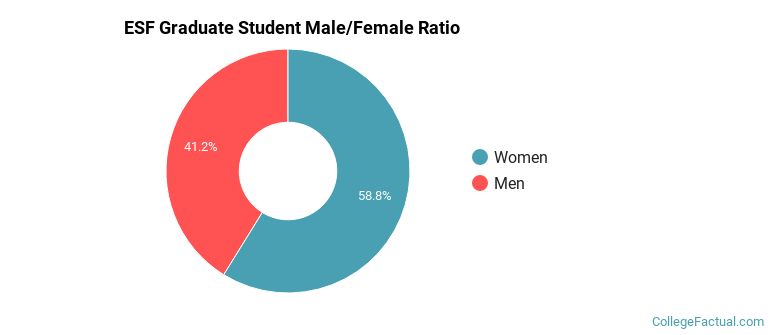
Male/Female Breakdown of Graduate Students
About 55% of full-time grad students are women, and 45% men.
For the gender breakdown for all students, go here.
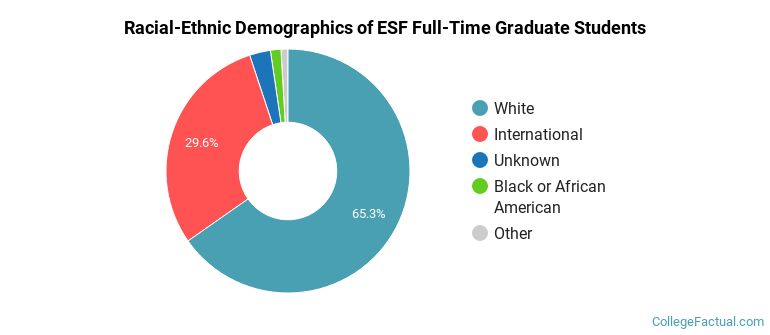
ESF Racial-Ethnic Breakdown of Graduate Students
| Race/Ethnicity | Number |
|---|---|
| White | 148 |
| International | 50 |
| Asian | 8 |
| Hispanic | 5 |
| Multi-Ethnic | 4 |
| Black or African American | 3 |
| Unknown | 1 |
| Native Hawaiian or Pacific Islander | 0 |
See racial/ethnic breakdown for all students.
| Race/Ethnicity | Number |
|---|---|
| White | 1,597 |
| International | 128 |
| Hispanic | 126 |
| Unknown | 82 |
| Asian | 81 |
| Multi-Ethnic | 60 |
| Black or African American | 42 |
| Native Hawaiian or Pacific Islander | 0 |
There are approximately 1,024 female students and 1,103 male students at ESF.
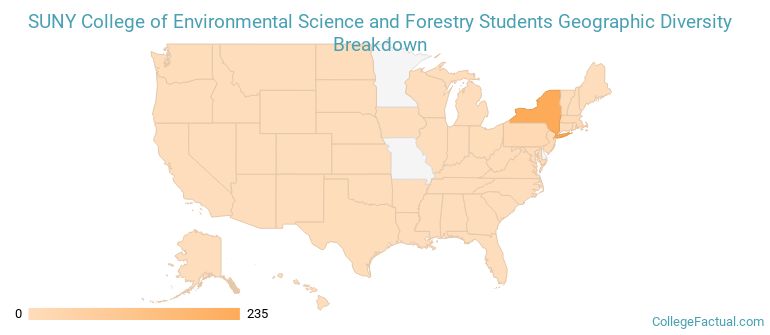
ESF ranks 1,099 out of 2,183 when it comes to geographic diversity.
25.87% of ESF students come from out of state, and 2.76% come from out of the country.
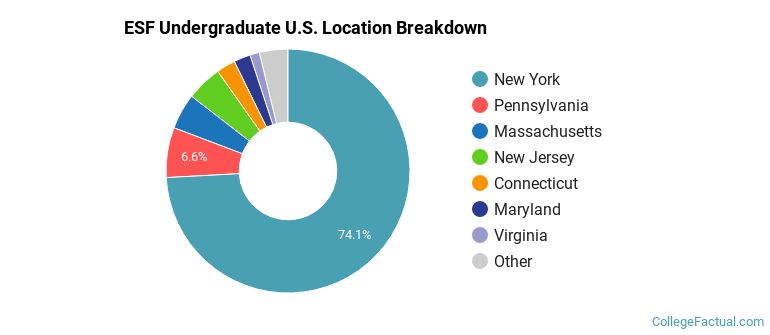
The undergraduate student body is split among 16 states (may include Washington D.C.). Click on the map for more detail.
| State | Amount |
|---|---|
| New York | 235 |
| Pennsylvania | 21 |
| Massachusetts | 15 |
| New Jersey | 15 |
| Connecticut | 8 |
Learn more about international students at ESF.
A traditional college student is defined as being between the ages of 18-21. At ESF, 61.64% of students fall into that category, compared to the national average of 60%.
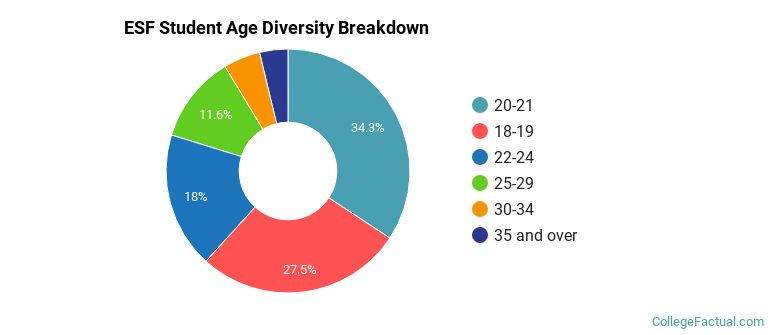
| Student Age Group | Amount |
|---|---|
| 20-21 | 757 |
| 18-19 | 607 |
| 22-24 | 398 |
| 25-29 | 256 |
| 30-34 | 108 |
| 35 and over | 83 |
| Under 18 | 0 |
Footnotes
*The racial-ethnic minorities count is calculated by taking the total number of students and subtracting white students, international students, and students whose race/ethnicity was unknown. This number is then divided by the total number of students at the school to obtain the racial-ethnic minorities percentage.
References
Department of Homeland Security Citizenship and Immigration Services
Image Credit: By DASonnenfeld under License