SUNY Delhi total enrollment is approximately 3,077 students. 2,390 are undergraduates and 16 are graduate students.
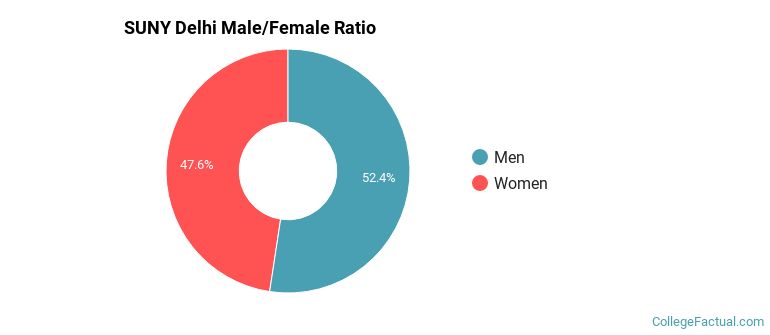
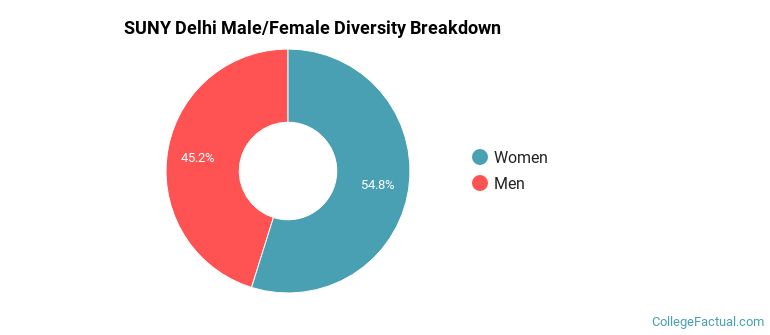
Male/Female Breakdown of Undergraduates
The full-time SUNY Delhi undergraduate population is made up of 49% women, and 51% men.
For the gender breakdown for all students, go here.
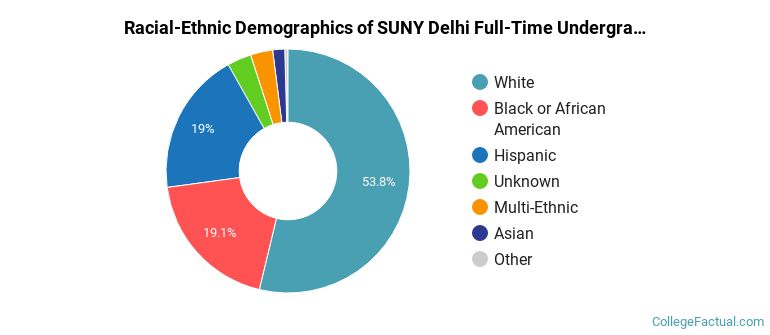
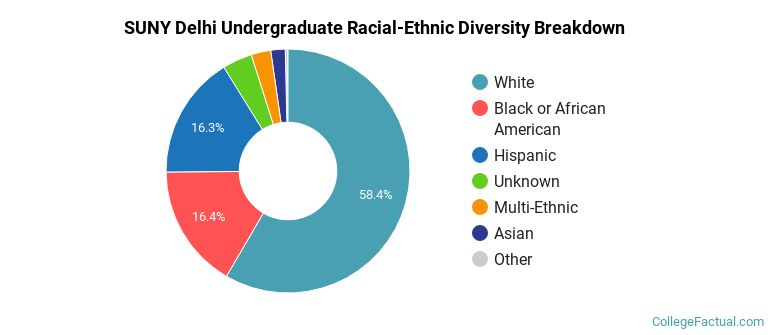
SUNY Delhi Racial/Ethnic Breakdown of Undergraduates
| Race/Ethnicity | Number |
|---|---|
| White | 1,292 |
| Hispanic | 468 |
| Black or African American | 428 |
| Unknown | 86 |
| Multi-Ethnic | 60 |
| Asian | 39 |
| International | 7 |
| Native Hawaiian or Pacific Islander | 2 |
See racial/ethnic breakdown for all students.
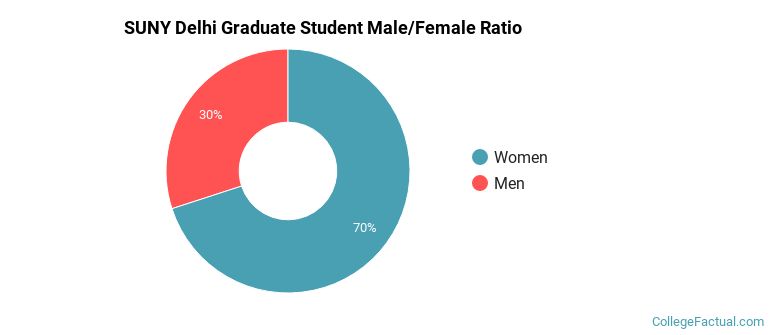
Male/Female Breakdown of Graduate Students
About 81% of full-time grad students are women, and 19% men.
For the gender breakdown for all students, go here.
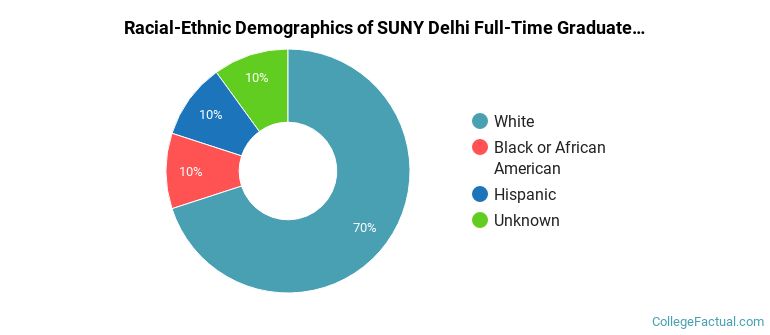
SUNY Delhi Racial-Ethnic Breakdown of Graduate Students
| Race/Ethnicity | Number |
|---|---|
| White | 12 |
| Asian | 1 |
| Black or African American | 1 |
| Hispanic | 1 |
| Unknown | 1 |
| Native Hawaiian or Pacific Islander | 0 |
| International | 0 |
| Multi-Ethnic | 0 |
See racial/ethnic breakdown for all students.
| Race/Ethnicity | Number |
|---|---|
| White | 1,777 |
| Hispanic | 535 |
| Black or African American | 478 |
| Unknown | 125 |
| Multi-Ethnic | 72 |
| Asian | 67 |
| International | 8 |
| Native Hawaiian or Pacific Islander | 2 |
There are approximately 1,723 female students and 1,354 male students at SUNY Delhi.
SUNY Delhi ranks 1,841 out of 2,183 when it comes to geographic diversity.
2.66% of SUNY Delhi students come from out of state, and 1.26% come from out of the country.
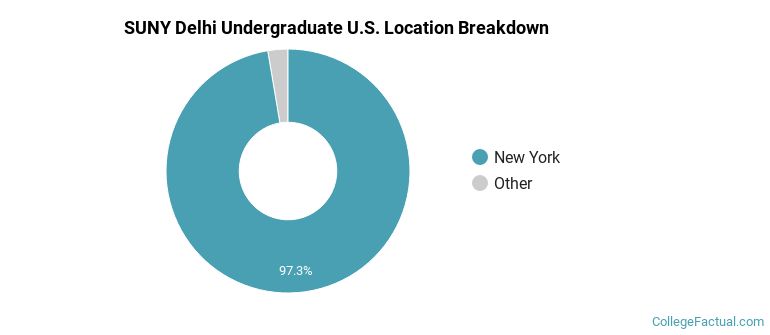
The undergraduate student body is split among 9 states (may include Washington D.C.). Click on the map for more detail.
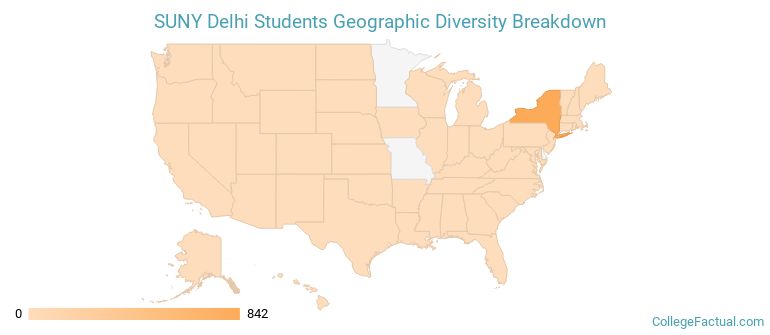
| State | Amount |
|---|---|
| New York | 842 |
| New Jersey | 8 |
| Connecticut | 4 |
| Massachusetts | 3 |
| Pennsylvania | 3 |
Students from 7 countries are represented at this school, with the majority of the international students coming from Japan, China, and India.
Learn more about international students at SUNY Delhi.
A traditional college student is defined as being between the ages of 18-21. At SUNY Delhi, 60.07% of students fall into that category, compared to the national average of 60%.
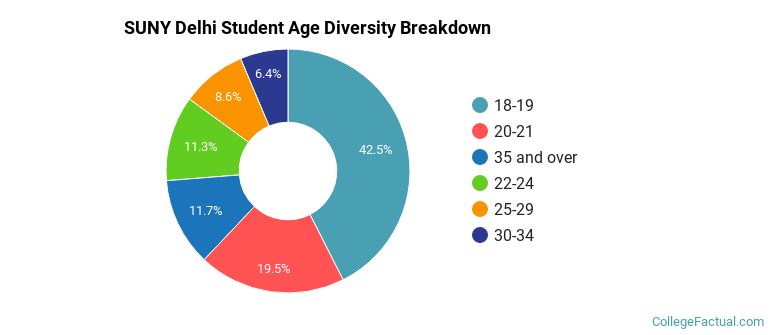
| Student Age Group | Amount |
|---|---|
| 18-19 | 1,446 |
| 20-21 | 663 |
| 35 and over | 397 |
| 22-24 | 384 |
| 25-29 | 293 |
| 30-34 | 216 |
| Under 18 | 0 |
Footnotes
*The racial-ethnic minorities count is calculated by taking the total number of students and subtracting white students, international students, and students whose race/ethnicity was unknown. This number is then divided by the total number of students at the school to obtain the racial-ethnic minorities percentage.
References