SUNY Poly total enrollment is approximately 3,044 students. 1,903 are undergraduates and 261 are graduate students.
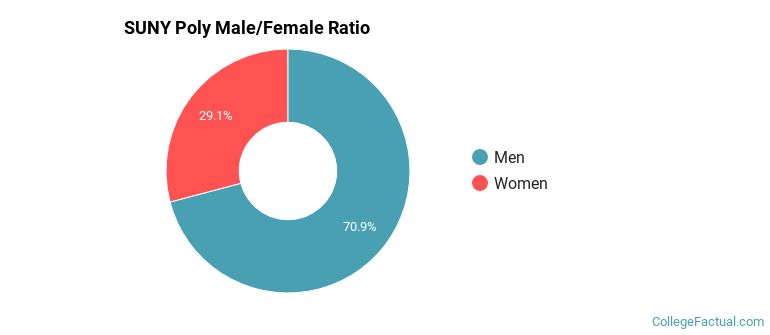
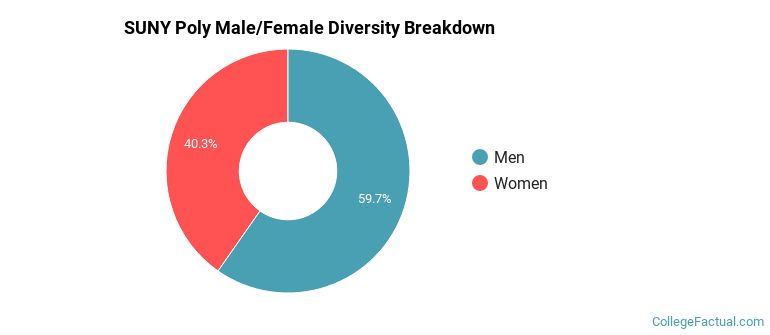
Male/Female Breakdown of Undergraduates
The full-time SUNY Poly undergraduate population is made up of 30% women, and 70% men.
For the gender breakdown for all students, go here.
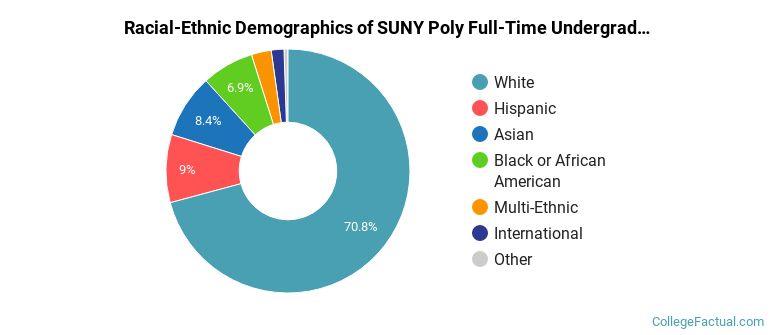
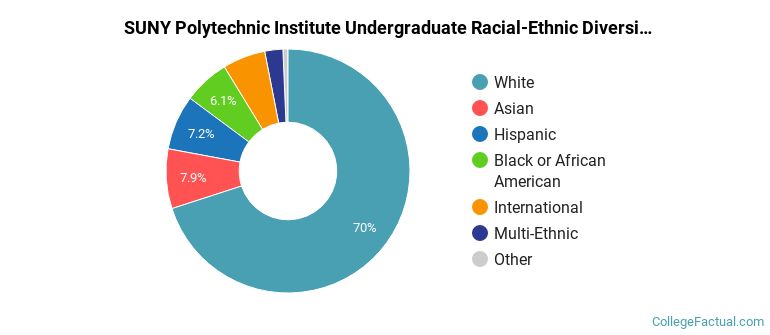
SUNY Poly Racial/Ethnic Breakdown of Undergraduates
| Race/Ethnicity | Number |
|---|---|
| White | 1,318 |
| Hispanic | 179 |
| Asian | 161 |
| Black or African American | 133 |
| Multi-Ethnic | 69 |
| International | 27 |
| Unknown | 6 |
| Native Hawaiian or Pacific Islander | 3 |
See racial/ethnic breakdown for all students.
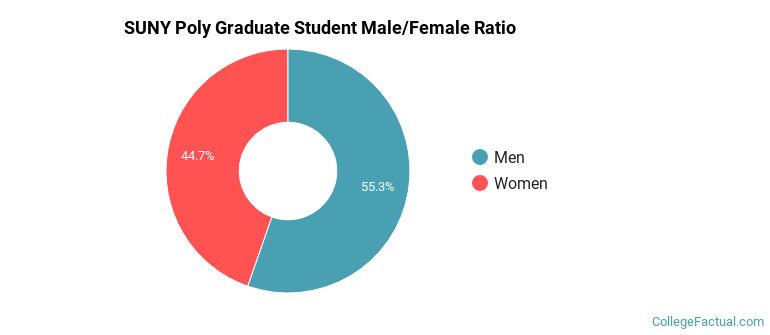
Male/Female Breakdown of Graduate Students
About 53% of full-time grad students are women, and 47% men.
For the gender breakdown for all students, go here.
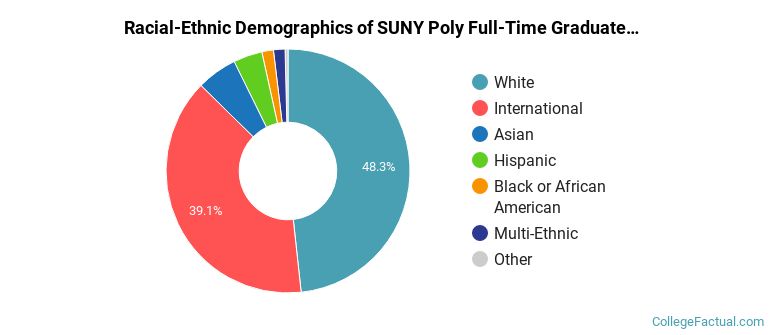
SUNY Poly Racial-Ethnic Breakdown of Graduate Students
| Race/Ethnicity | Number |
|---|---|
| White | 156 |
| International | 61 |
| Asian | 19 |
| Hispanic | 11 |
| Black or African American | 8 |
| Multi-Ethnic | 5 |
| Native Hawaiian or Pacific Islander | 1 |
| Unknown | 0 |
See racial/ethnic breakdown for all students.
| Race/Ethnicity | Number |
|---|---|
| White | 2,123 |
| Asian | 249 |
| Hispanic | 243 |
| Black or African American | 179 |
| International | 137 |
| Multi-Ethnic | 92 |
| Unknown | 8 |
| Native Hawaiian or Pacific Islander | 6 |
There are approximately 1,249 female students and 1,795 male students at SUNY Poly.
SUNY Poly ranks 1,819 out of 2,183 when it comes to geographic diversity.
3.5% of SUNY Poly students come from out of state, and 0% come from out of the country.
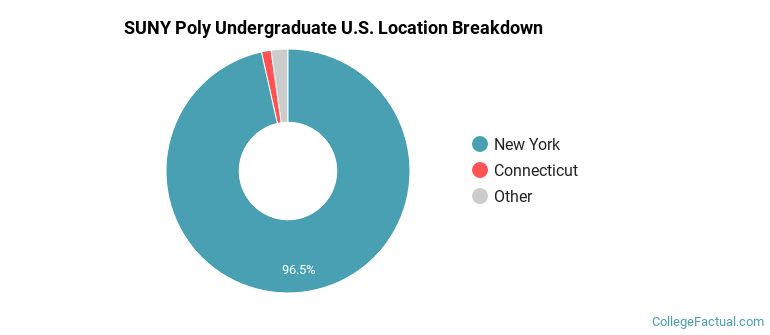
The undergraduate student body is split among 7 states (may include Washington D.C.). Click on the map for more detail.
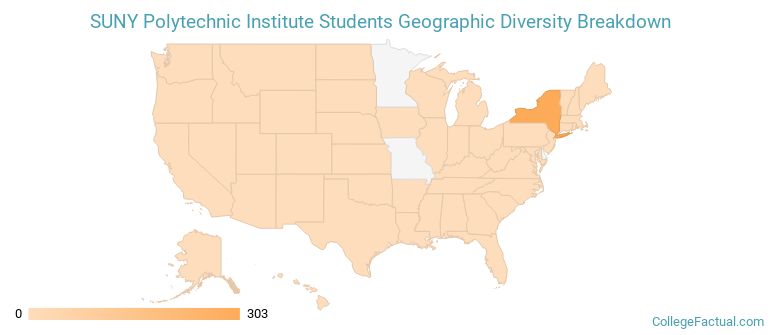
| State | Amount |
|---|---|
| New York | 303 |
| Connecticut | 4 |
| New Jersey | 3 |
| California | 1 |
| New Hampshire | 1 |
Learn more about international students at SUNY Poly.
A traditional college student is defined as being between the ages of 18-21. At SUNY Poly, 48.39% of students fall into that category, compared to the national average of 60%.
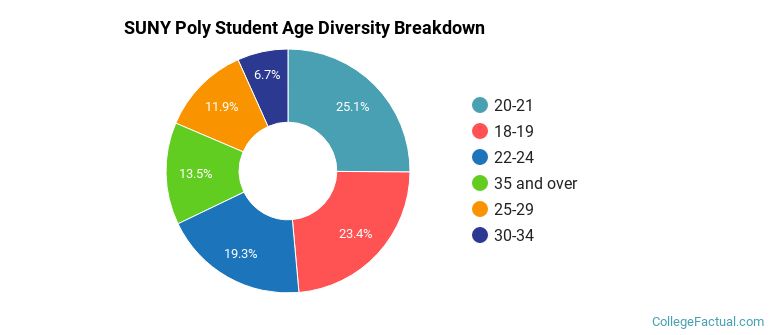
| Student Age Group | Amount |
|---|---|
| 20-21 | 729 |
| 18-19 | 680 |
| 22-24 | 560 |
| 35 and over | 393 |
| 25-29 | 344 |
| 30-34 | 195 |
| Under 18 | 0 |
Footnotes
*The racial-ethnic minorities count is calculated by taking the total number of students and subtracting white students, international students, and students whose race/ethnicity was unknown. This number is then divided by the total number of students at the school to obtain the racial-ethnic minorities percentage.
References
Department of Homeland Security Citizenship and Immigration Services
Image Credit: By Bssasidhar under License
Learn more about how College Factual creates their Diversity Rankings.