SUNY Maritime College total enrollment is approximately 1,671 students. 1,443 are undergraduates and 87 are graduate students.
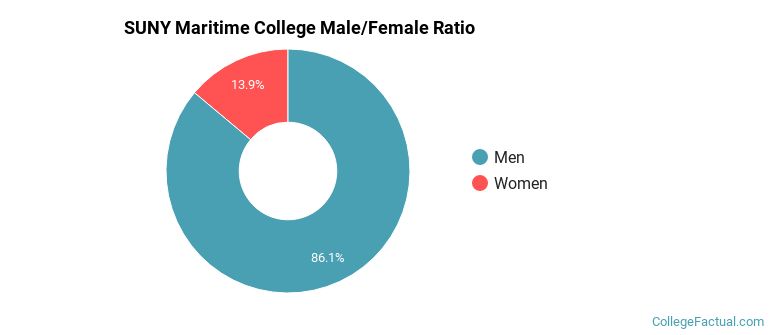
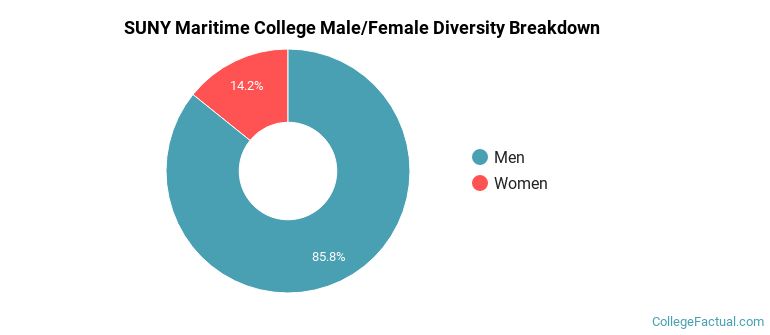
Male/Female Breakdown of Undergraduates
The full-time SUNY Maritime College undergraduate population is made up of 14% women, and 86% men.
For the gender breakdown for all students, go here.
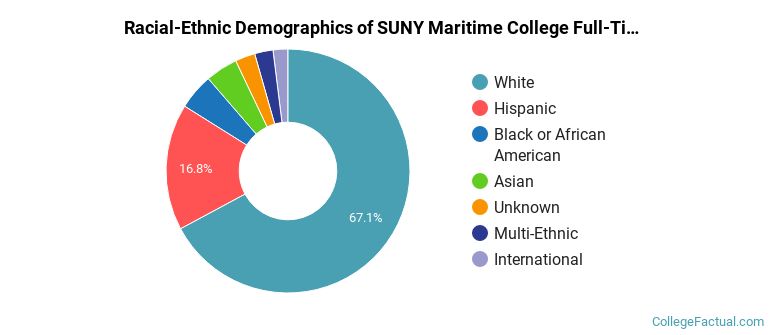
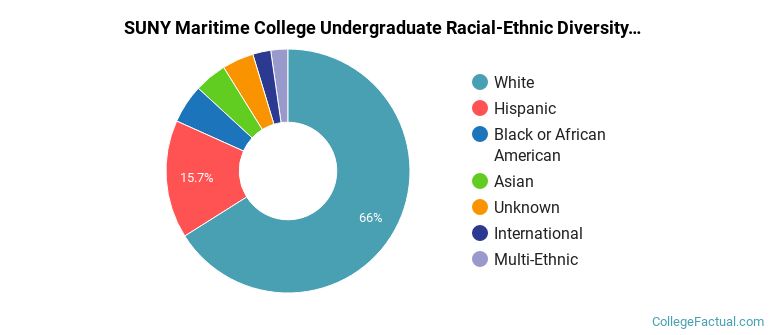
SUNY Maritime College Racial/Ethnic Breakdown of Undergraduates
| Race/Ethnicity | Number |
|---|---|
| White | 952 |
| Hispanic | 245 |
| Black or African American | 73 |
| Asian | 72 |
| Multi-Ethnic | 38 |
| International | 31 |
| Unknown | 31 |
| Native Hawaiian or Pacific Islander | 0 |
See racial/ethnic breakdown for all students.
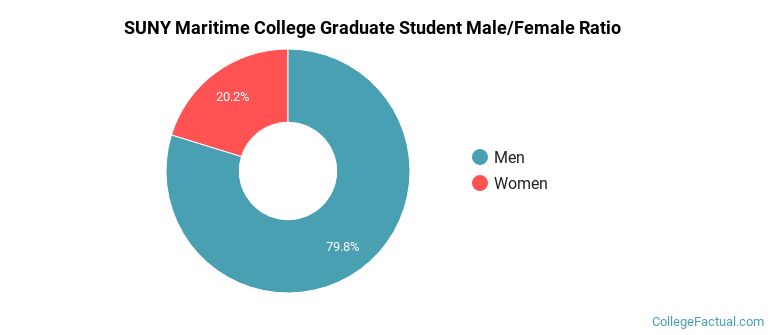
Male/Female Breakdown of Graduate Students
About 16% of full-time grad students are women, and 84% men.
For the gender breakdown for all students, go here.
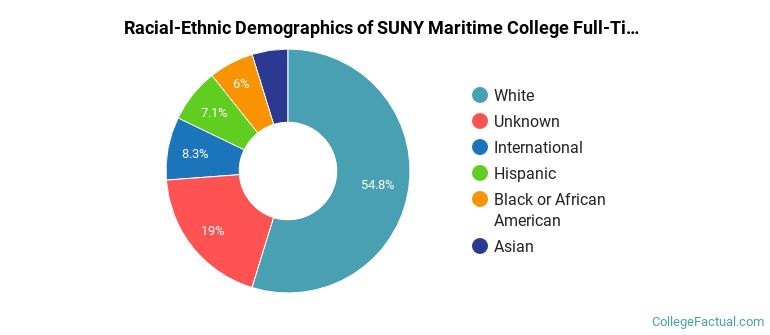
SUNY Maritime College Racial-Ethnic Breakdown of Graduate Students
| Race/Ethnicity | Number |
|---|---|
| White | 53 |
| Unknown | 10 |
| Black or African American | 9 |
| Hispanic | 7 |
| International | 6 |
| Asian | 2 |
| Native Hawaiian or Pacific Islander | 0 |
| Multi-Ethnic | 0 |
See racial/ethnic breakdown for all students.
| Race/Ethnicity | Number |
|---|---|
| White | 1,087 |
| Hispanic | 274 |
| Black or African American | 91 |
| Asian | 87 |
| Unknown | 50 |
| International | 42 |
| Multi-Ethnic | 39 |
| Native Hawaiian or Pacific Islander | 0 |
There are approximately 236 female students and 1,435 male students at SUNY Maritime College.
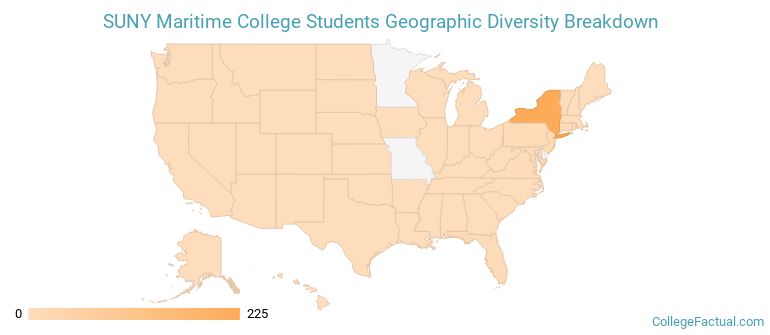
SUNY Maritime College ranks 1,130 out of 2,183 when it comes to geographic diversity.
25.9% of SUNY Maritime College students come from out of state, and 0.32% come from out of the country.
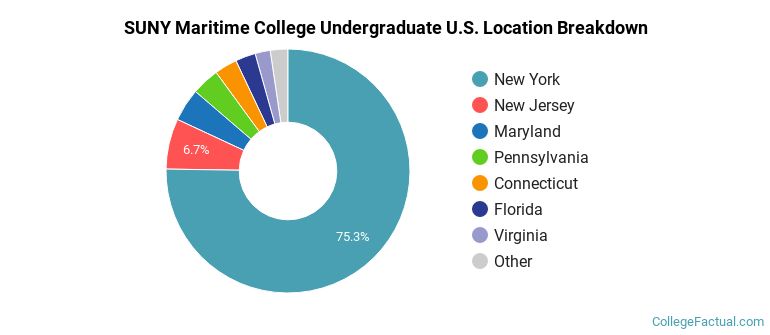
The undergraduate student body is split among 14 states (may include Washington D.C.). Click on the map for more detail.
| State | Amount |
|---|---|
| New York | 225 |
| New Jersey | 20 |
| Maryland | 13 |
| Pennsylvania | 11 |
| Connecticut | 9 |
Learn more about international students at SUNY Maritime College.
A traditional college student is defined as being between the ages of 18-21. At SUNY Maritime College, 66.56% of students fall into that category, compared to the national average of 60%.
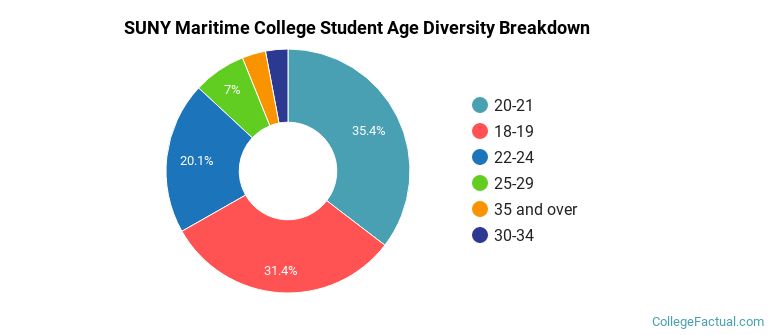
| Student Age Group | Amount |
|---|---|
| 20-21 | 633 |
| 18-19 | 561 |
| 22-24 | 360 |
| 25-29 | 125 |
| 35 and over | 56 |
| 30-34 | 53 |
| Under 18 | 0 |
Footnotes
*The racial-ethnic minorities count is calculated by taking the total number of students and subtracting white students, international students, and students whose race/ethnicity was unknown. This number is then divided by the total number of students at the school to obtain the racial-ethnic minorities percentage.
References
Department of Homeland Security Citizenship and Immigration Services
Image Credit: By User:Jim.henderson under License