Taft Law School total enrollment is approximately 614 students. 2 are undergraduates and 342 are graduate students.
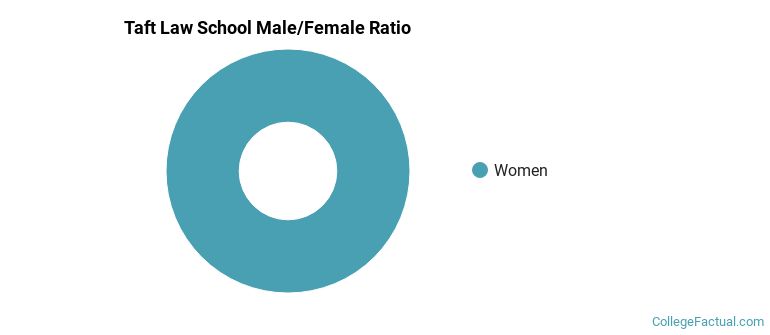
Male/Female Breakdown of Undergraduates
The full-time Taft Law School undergraduate population is made up of 100% women, and 0% men.
For the gender breakdown for all students, go here.
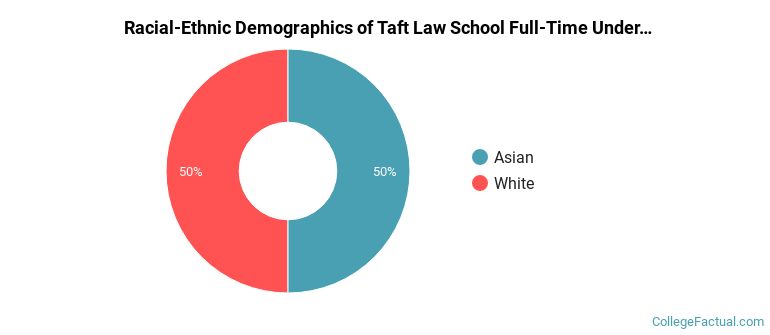
Taft Law School Racial/Ethnic Breakdown of Undergraduates
| Race/Ethnicity | Number |
|---|---|
| Asian | 1 |
| Black or African American | 1 |
| Hispanic | 0 |
| White | 0 |
| Native Hawaiian or Pacific Islander | 0 |
| International | 0 |
| Multi-Ethnic | 0 |
| Unknown | 0 |
See racial/ethnic breakdown for all students.
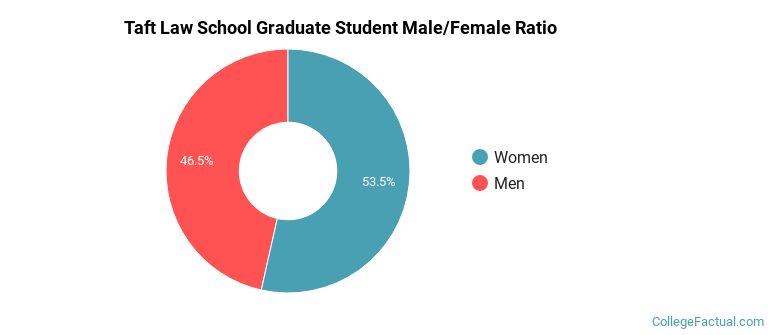
Male/Female Breakdown of Graduate Students
About 54% of full-time grad students are women, and 46% men.
For the gender breakdown for all students, go here.
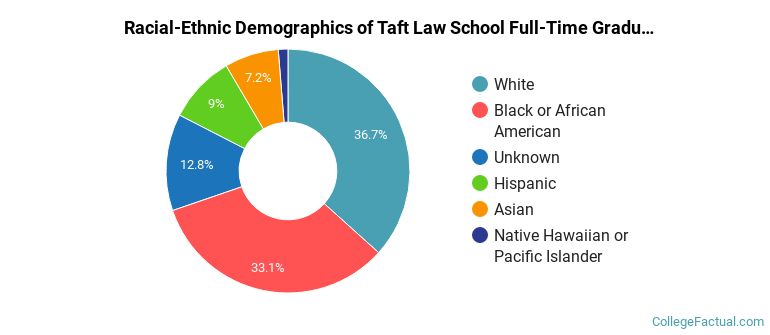
Taft Law School Racial-Ethnic Breakdown of Graduate Students
| Race/Ethnicity | Number |
|---|---|
| White | 128 |
| Black or African American | 98 |
| Unknown | 48 |
| Hispanic | 33 |
| Asian | 30 |
| Native Hawaiian or Pacific Islander | 1 |
| International | 0 |
| Multi-Ethnic | 0 |
See racial/ethnic breakdown for all students.
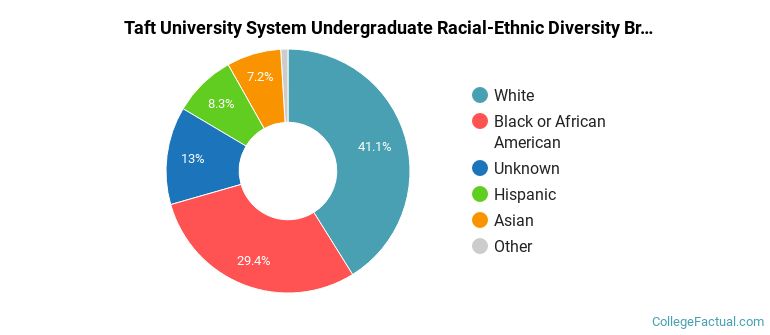
| Race/Ethnicity | Number |
|---|---|
| White | 246 |
| Black or African American | 171 |
| Unknown | 79 |
| Asian | 57 |
| Hispanic | 52 |
| Native Hawaiian or Pacific Islander | 2 |
| International | 0 |
| Multi-Ethnic | 0 |
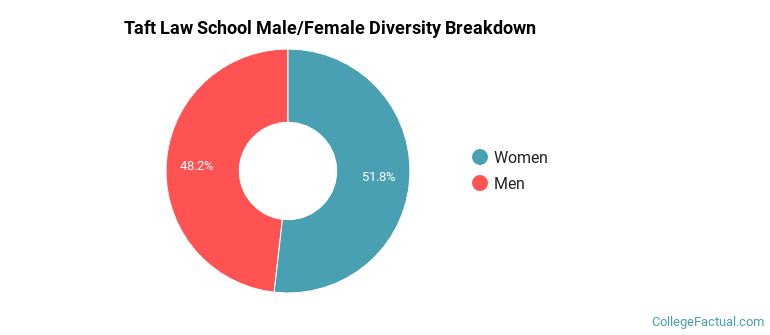
There are approximately 307 female students and 307 male students at Taft Law School.
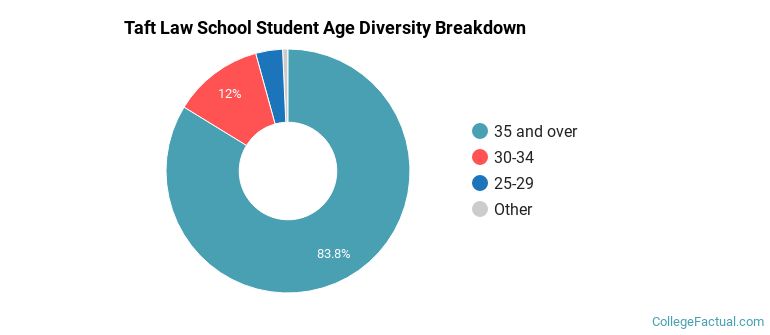
| Student Age Group | Amount |
|---|---|
| 35 and over | 588 |
| 30-34 | 84 |
| 25-29 | 25 |
| 22-24 | 5 |
| 18-19 | 0 |
| 20-21 | 0 |
| Under 18 | 0 |
Footnotes
*The racial-ethnic minorities count is calculated by taking the total number of students and subtracting white students, international students, and students whose race/ethnicity was unknown. This number is then divided by the total number of students at the school to obtain the racial-ethnic minorities percentage.
References
Department of Homeland Security Citizenship and Immigration Services
Read College Factual's Diversity Ranking Methodology.