Explore the best ranked schools for the programs you are most interested in.
Technical Education Center-Osceola was not ranked in College Factual's Best Overall Colleges report this year. This may be because not enough data was available.
See all of the rankings for Technical Education Center-Osceola.
As long as you meet basic requirements, you should not have any trouble getting into Technical Education Center-Osceola since the school has an open admissions policy. Still, be sure to submit any requested materials and that your application is completed in full.
At Technical Education Center-Osceola, the student to faculty ratio is an excellent 8 to 1. That's much better than the national average of 15 to 1. This indicates that many classes will probably be small, and students will have ample opportunites to work closely with their professors and classmates.
The freshmen retention rate is a sign of how many full-time students like a college or university well enough to come back for their sophomore year. At Technical Education Center-Osceola this rate is 54%, which is a bit lower than the national average of 68%.
During the 2017-2018 academic year, there were 591 undergraduates at Technical Education Center-Osceola with 224 being full-time and 367 being part-time.
The net price is calculated by adding tuition, room, board and other costs and subtracting financial aid.Note that the net price is typically less than the published for a school. For more information on the sticker price of Technical Education Center-Osceola, see our tuition and fees and room and board pages.
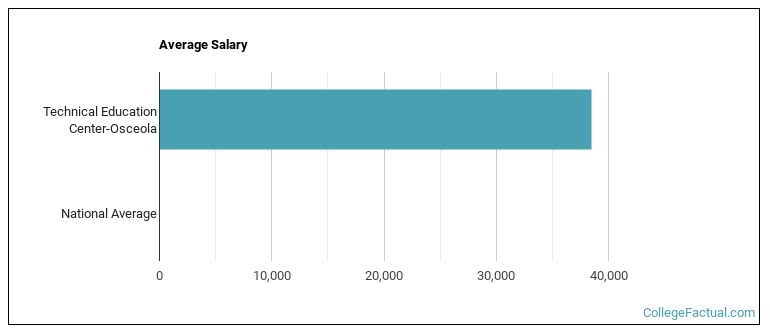
See which majors at Technical Education Center-Osceola make the most money.
Get more details about the location of Technical Education Center-Osceola.

Contact details for Technical Education Center-Osceola are given below.
| Contact Details | |
|---|---|
| Address: | 501 Simpson Rd, Kissimmee, FL 34744 |
| Phone: | 407-344-5080 |
| Website: | osceolaschools.net/otech |
| Most Popular Majors | Bachelor’s Degrees | Average Salary of Graduates |
|---|---|---|
| Vehicle Maintenance & Repair | 63 | NA |
| Allied Health & Medical Assisting Services | 57 | NA |
| Clinical/Medical Laboratory Science | 54 | NA |
| Criminal Justice & Corrections | 43 | NA |
| Cosmetology | 38 | NA |
| Information Technology | 20 | NA |
| Practical Nursing & Nursing Assistants | 19 | NA |
| Dental Support Services | 16 | NA |
| Environmental Control Technology | 14 | NA |
| Graphic Communications | 12 | NA |
Footnotes
*The racial-ethnic minorities count is calculated by taking the total number of students and subtracting white students, international students, and students whose race/ethnicity was unknown. This number is then divided by the total number of students at the school to obtain the racial-ethnic minorities percentage.
References
More about our data sources and methodologies.