Explore the best ranked schools for the programs you are most interested in.
TCAT - Crossville was not ranked in College Factual's 2025 Best Overall Colleges report. This could be for a number of reasons, including lack of data.
See all of the rankings for Tennessee College of Applied Technology - Crossville.
As long as you meet basic requirements, you should not have any trouble getting into Tennessee College of Applied Technology - Crossville since the school has an open admissions policy. Still, be sure to submit any requested materials and that your application is completed in full.
The student to faculty ratio at Tennessee College of Applied Technology - Crossville is 20 to 1, which is high when compared to the national average of 15 to 1. This may indicate that some of your classes will be larger in size than they would be at other schools. However, upper level classes will probably be smaller.
The freshmen retention rate of 87% tells us that most first-year, full-time students like Tennessee College of Applied Technology - Crossville enough to come back for another year. This is a fair bit higher than the national average of 68%. That's certainly something to check off in the good column about the school.
During the 2017-2018 academic year, there were 494 undergraduates at TCAT - Crossville with 342 being full-time and 152 being part-time.
The net price is calculated by adding tuition, room, board and other costs and subtracting financial aid.Note that the net price is typically less than the published for a school. For more information on the sticker price of TCAT - Crossville, see our tuition and fees and room and board pages.
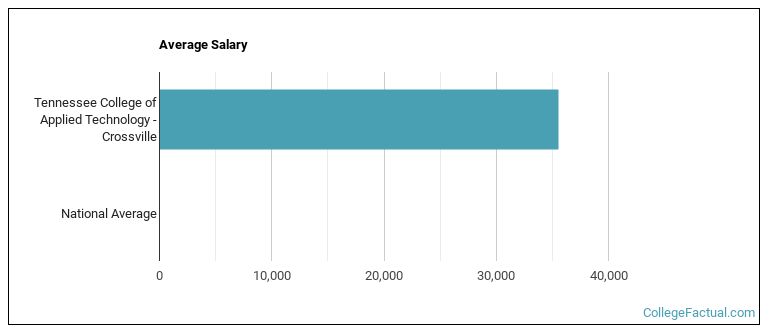
See which majors at Tennessee College of Applied Technology - Crossville make the most money.
Get more details about the location of Tennessee College of Applied Technology - Crossville.

Contact details for TCAT - Crossville are given below.
| Contact Details | |
|---|---|
| Address: | 910 Miller Avenue, Crossville, TN 38555 |
| Phone: | 931-484-7502 |
| Website: | www.tcatcrossville.edu/ |
| Most Popular Majors | Bachelor’s Degrees | Average Salary of Graduates |
|---|---|---|
| Practical Nursing & Nursing Assistants | 54 | NA |
| Vehicle Maintenance & Repair | 53 | NA |
| Precision Metal Working | 42 | NA |
| Ground Transportation | 32 | NA |
| Heavy/Industrial Equipment Maintenance | 27 | NA |
| Information Technology | 19 | NA |
| Building Management & Inspection | 17 | NA |
| Cosmetology | 17 | NA |
| Business Support & Assistant Services | 16 | NA |
| Heating, Air Conditioning, Ventilation & Refrigeration | 11 | NA |
Footnotes
*The racial-ethnic minorities count is calculated by taking the total number of students and subtracting white students, international students, and students whose race/ethnicity was unknown. This number is then divided by the total number of students at the school to obtain the racial-ethnic minorities percentage.
References
More about our data sources and methodologies.