Explore the best ranked schools for the programs you are most interested in.
TCAT - Dickson was not ranked in College Factual's 2025 Best Overall Colleges report. This could be for a number of reasons, including lack of data.
See all of the rankings for Tennessee College of Applied Technology - Dickson.
Since Tennessee College of Applied Technology - Dickson has an open admissions policy, being accepted to the school isn't that hard. However, a full basic things - such as a high school diploma or equivalent - may be required. Also, go over your application to make sure it is complete before you submit it.
The student to faculty ratio is often used to estimate how much interaction there is between professors and their students at a college or university. At Tennessee College of Applied Technology - Dickson, this ratio is 17 to 1, which is on par with the national average of 15 to 1. That's not bad at all.
Tennessee College of Applied Technology - Dickson has a freshmen retention rate of 81%. That's a good sign that full-time students like the school and their professors enough to want to stick around for another year. It's also a sign that the admissions team did a good job in choosing applicants who were a good fit for the school.
During the 2017-2018 academic year, there were 798 undergraduates at TCAT - Dickson with 627 being full-time and 171 being part-time.
The net price is calculated by adding tuition, room, board and other costs and subtracting financial aid.Note that the net price is typically less than the published for a school. For more information on the sticker price of TCAT - Dickson, see our tuition and fees and room and board pages.
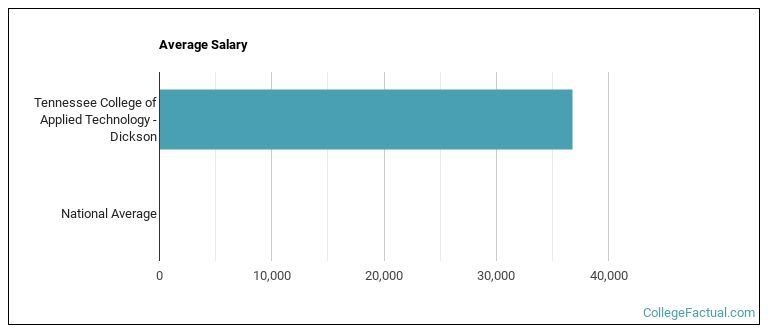
See which majors at Tennessee College of Applied Technology - Dickson make the most money.
Get more details about the location of Tennessee College of Applied Technology - Dickson.

Contact details for TCAT - Dickson are given below.
| Contact Details | |
|---|---|
| Address: | 740 Hwy 46, Dickson, TN 37055 |
| Phone: | 615-441-6220 |
| Website: | https://www.tcatdickson.edu/ |
| Most Popular Majors | Bachelor’s Degrees | Average Salary of Graduates |
|---|---|---|
| Practical Nursing & Nursing Assistants | 106 | NA |
| Precision Metal Working | 74 | NA |
| Cosmetology | 63 | NA |
| Vehicle Maintenance & Repair | 54 | NA |
| Heavy/Industrial Equipment Maintenance | 49 | NA |
| Heating, Air Conditioning, Ventilation & Refrigeration | 42 | NA |
| Information Technology | 30 | NA |
| Business Support & Assistant Services | 29 | NA |
| Design & Applied Arts | 19 | NA |
| Building Management & Inspection | 12 | NA |
Footnotes
*The racial-ethnic minorities count is calculated by taking the total number of students and subtracting white students, international students, and students whose race/ethnicity was unknown. This number is then divided by the total number of students at the school to obtain the racial-ethnic minorities percentage.
References
More about our data sources and methodologies.