Explore the best ranked schools for the programs you are most interested in.
TCAT - Nashville was not ranked in College Factual's Best Overall Colleges report this year. This may be because not enough data was available.
See all of the rankings for Tennessee College of Applied Technology - Nashville.
Since Tennessee College of Applied Technology - Nashville has an open admissions policy, being accepted to the school isn't that hard. However, a full basic things - such as a high school diploma or equivalent - may be required. Also, go over your application to make sure it is complete before you submit it.
With a student to faculty ratio of 17 to 1, Tennessee College of Applied Technology - Nashville is about average in this regard as the nationwide rate is 15 to 1. While this does not translate directly to class size, it's a good indicator of how much time professors will have to spend with their students on a one-on-one basis.
The freshmen retention rate of 77% tells us that most first-year, full-time students like Tennessee College of Applied Technology - Nashville enough to come back for another year. This is a fair bit higher than the national average of 68%. That's certainly something to check off in the good column about the school.
During the 2017-2018 academic year, there were 815 undergraduates at TCAT - Nashville with 619 being full-time and 196 being part-time.
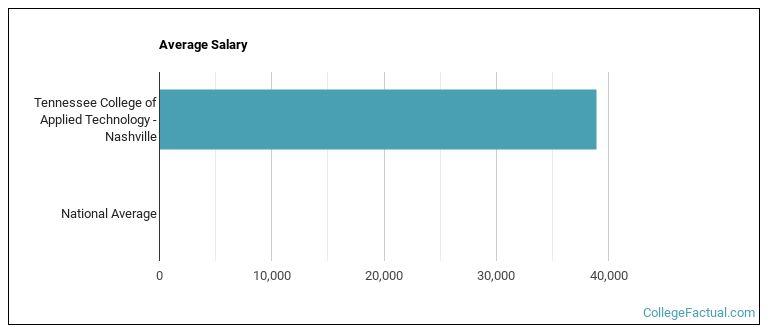
The net price is calculated by adding tuition, room, board and other costs and subtracting financial aid.Note that the net price is typically less than the published for a school. For more information on the sticker price of TCAT - Nashville, see our tuition and fees and room and board pages.
See which majors at Tennessee College of Applied Technology - Nashville make the most money.
Get more details about the location of Tennessee College of Applied Technology - Nashville.

Contact details for TCAT - Nashville are given below.
| Contact Details | |
|---|---|
| Address: | 100 White Bridge Rd, Nashville, TN 37209-4515 |
| Phone: | 615-425-5500 |
| Website: | www.tcatnashville.edu/ |
| Most Popular Majors | Bachelor’s Degrees | Average Salary of Graduates |
|---|---|---|
| Cosmetology | 95 | NA |
| Precision Metal Working | 73 | NA |
| Practical Nursing & Nursing Assistants | 65 | NA |
| Vehicle Maintenance & Repair | 60 | NA |
| Heating, Air Conditioning, Ventilation & Refrigeration | 45 | NA |
| Dental Support Services | 39 | NA |
| Building Management & Inspection | 27 | NA |
| Information Technology | 18 | NA |
| Business Support & Assistant Services | 11 | NA |
| Human Development & Family Studies | 9 | NA |
Footnotes
*The racial-ethnic minorities count is calculated by taking the total number of students and subtracting white students, international students, and students whose race/ethnicity was unknown. This number is then divided by the total number of students at the school to obtain the racial-ethnic minorities percentage.
References
More about our data sources and methodologies.