Explore the best ranked schools for the programs you are most interested in.
TCAT - Newbern was not ranked in College Factual's Best Overall Colleges report this year. This may be because not enough data was available.
See all of the rankings for Tennessee College of Applied Technology - Newbern.
If you are worried about getting into Tennessee College of Applied Technology - Newbern, don't be. The school has a liberal open admissions policy, which means you only need to meet basic requirements in order to be admitted. Still, be sure to submit a complete application and provide any other requested materials.
At TCAT - Newbern, the student to faculty ratio is an excellent 12 to 1. That's much better than the national average of 15 to 1. This indicates that many classes will probably be small, and students will have ample opportunites to work closely with their professors and classmates.
The freshmen retention rate of 82% tells us that most first-year, full-time students like Tennessee College of Applied Technology - Newbern enough to come back for another year. This is a fair bit higher than the national average of 68%. That's certainly something to check off in the good column about the school.
During the 2017-2018 academic year, there were 477 undergraduates at TCAT - Newbern with 301 being full-time and 176 being part-time.
The net price is calculated by adding tuition, room, board and other costs and subtracting financial aid.Note that the net price is typically less than the published for a school. For more information on the sticker price of TCAT - Newbern, see our tuition and fees and room and board pages.
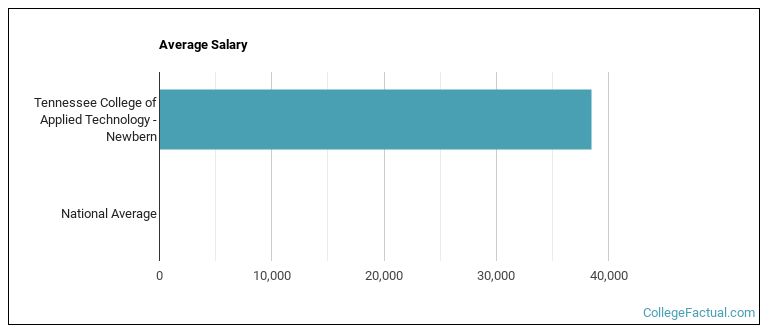
See which majors at Tennessee College of Applied Technology - Newbern make the most money.
Get more details about the location of Tennessee College of Applied Technology - Newbern.

Contact details for TCAT - Newbern are given below.
| Contact Details | |
|---|---|
| Address: | 340 Washington St, Newbern, TN 38059 |
| Phone: | 731-627-2511 |
| Website: | https://www.tcatnorthwest.edu/ |
| Most Popular Majors | Bachelor’s Degrees | Average Salary of Graduates |
|---|---|---|
| Precision Metal Working | 44 | NA |
| Practical Nursing & Nursing Assistants | 42 | NA |
| Vehicle Maintenance & Repair | 32 | NA |
| Heavy/Industrial Equipment Maintenance | 31 | NA |
| Ground Transportation | 31 | NA |
| Cosmetology | 21 | NA |
| Information Technology | 20 | NA |
| Heating, Air Conditioning, Ventilation & Refrigeration | 19 | NA |
| Electromechanical Engineering Technology | 15 | NA |
| Drafting & Design Engineering Technology | 12 | NA |
Footnotes
*The racial-ethnic minorities count is calculated by taking the total number of students and subtracting white students, international students, and students whose race/ethnicity was unknown. This number is then divided by the total number of students at the school to obtain the racial-ethnic minorities percentage.
References
More about our data sources and methodologies.