In its yearly rankings, College Factual analyzes over 2,000 colleges and universities to determine which ones are the best in a variety of categories, such as overall value, quality, diversity, which schools are the best for each major, and much more.
Tennessee State University was awarded 2 badges in the 2025 rankings. The highest ranked major at the school is health professions.
Explore the best ranked schools for the programs you are most interested in.
According to College Factual's 2025 analysis, Tennessee State University is ranked #1,570 out of 2,152 schools in the nation that were analyzed for overall quality.
Tennessee State University is also ranked #29 out of 41 schools in Tennessee.
The student to faculty ratio at Tennessee State University is about average at 14 to 1. This ratio is often used to gauge how many students might be in an average class and how much time professors will have to spend with their students on an individual level. The national average for this metric is 15 to 1.
When estimating how much access students will have to their teachers, some people like to look at what percentage of faculty members are full time. This is because part-time teachers may not have as much time to spend on campus as their full-time counterparts.
The full-time faculty percentage at Tennessee State University is 70%. This is higher than the national average of 47%.
The freshmen retention rate is a sign of how many full-time students like a college or university well enough to come back for their sophomore year. At Tennessee State University this rate is 62%, which is a bit lower than the national average of 68%.
The on-time graduation rate is the percent of first-time, full time students who obtain their bachelor's degree in four years or less. This rate is 11% for first-time, full-time students at Tennessee State University, which is lower than the national rate of 33.3%.
Find out more about the retention and graduation rates at Tennessee State University.
During the 2017-2018 academic year, there were 6,000 undergraduates at Tennessee State University with 4,816 being full-time and 1,184 being part-time.
| $0-30 K | $30K-48K | $48-75 | $75-110K | $110K + |
|---|---|---|---|---|
| $11,035 | $10,890 | $12,899 | $14,899 | $19,106 |
The net price is calculated by adding tuition, room, board and other costs and subtracting financial aid.Note that the net price is typically less than the published for a school. For more information on the sticker price of Tennessee State University, see our tuition and fees and room and board pages.
While almost two-thirds of students nationwide take out loans to pay for college, the percentage may be quite different for the school you plan on attending. At Tennessee State University, approximately 42% of students took out student loans averaging $7,527 a year. That adds up to $30,108 over four years for those students.
Get more details about paying for Tennessee State University.
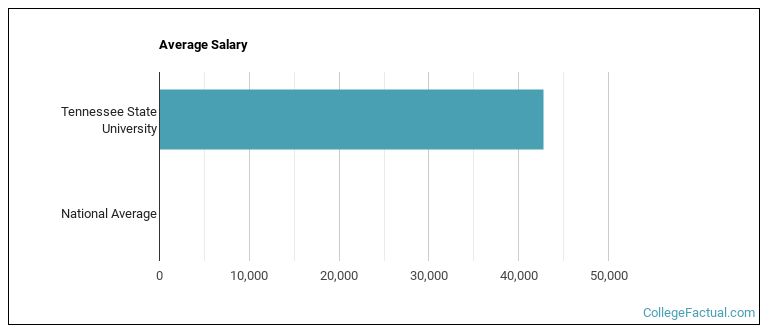
See which majors at Tennessee State University make the most money.
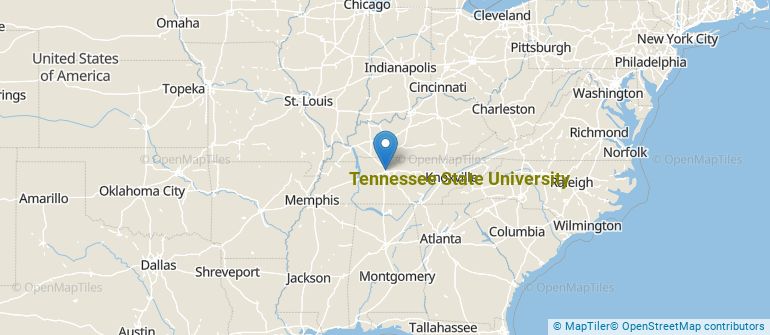
Get more details about the location of Tennessee State University.
Contact details for Tennessee State University are given below.
| Contact Details | |
|---|---|
| Address: | 3500 John A. Merritt Blvd, Nashville, TN 37209-1561 |
| Phone: | 615-963-5000 |
| Website: | www.tnstate.edu/ |
| Most Popular Majors | Bachelor’s Degrees | Average Salary of Graduates |
|---|---|---|
| Business Administration & Management | 129 | $40,077 |
| Educational Administration | 80 | NA |
| General Biology | 78 | $30,672 |
| General Psychology | 77 | $30,735 |
| Rehabilitation & Therapeutic Professions | 57 | NA |
| Criminal Justice & Corrections | 53 | $32,555 |
| Other Health Professions | 47 | $33,862 |
| Health & Physical Education | 47 | $24,722 |
| Computer Science | 46 | $50,628 |
| Teacher Education Grade Specific | 45 | $34,756 |
Online courses area a great option for busy, working students as well as for those who have scheduling conflicts and want to study on their own time. As time goes by, expect to see more and more online learning options become available.
In 2022-2023, 5,324 students took at least one online class at Tennessee State University. This is an increase from the 3,926 students who took online classes the previous year.
| Year | Took at Least One Online Class | Took All Classes Online |
|---|---|---|
| 2022-2023 | 5,324 | 918 |
| 2021-2022 | 3,926 | 1,275 |
| 2020-2021 | 3,954 | 861 |
| 2018-2019 | 7,655 | 438 |
Learn more about online learning at Tennessee State University.
If you’re considering Tennessee State University, here are some more schools you may be interested in knowing more about.
Curious on how these schools stack up against Tennessee State University? Pit them head to head with College Combat, our free interactive tool that lets you compare college on the features that matter most to you!
Footnotes
*The racial-ethnic minorities count is calculated by taking the total number of students and subtracting white students, international students, and students whose race/ethnicity was unknown. This number is then divided by the total number of students at the school to obtain the racial-ethnic minorities percentage.
References
More about our data sources and methodologies.